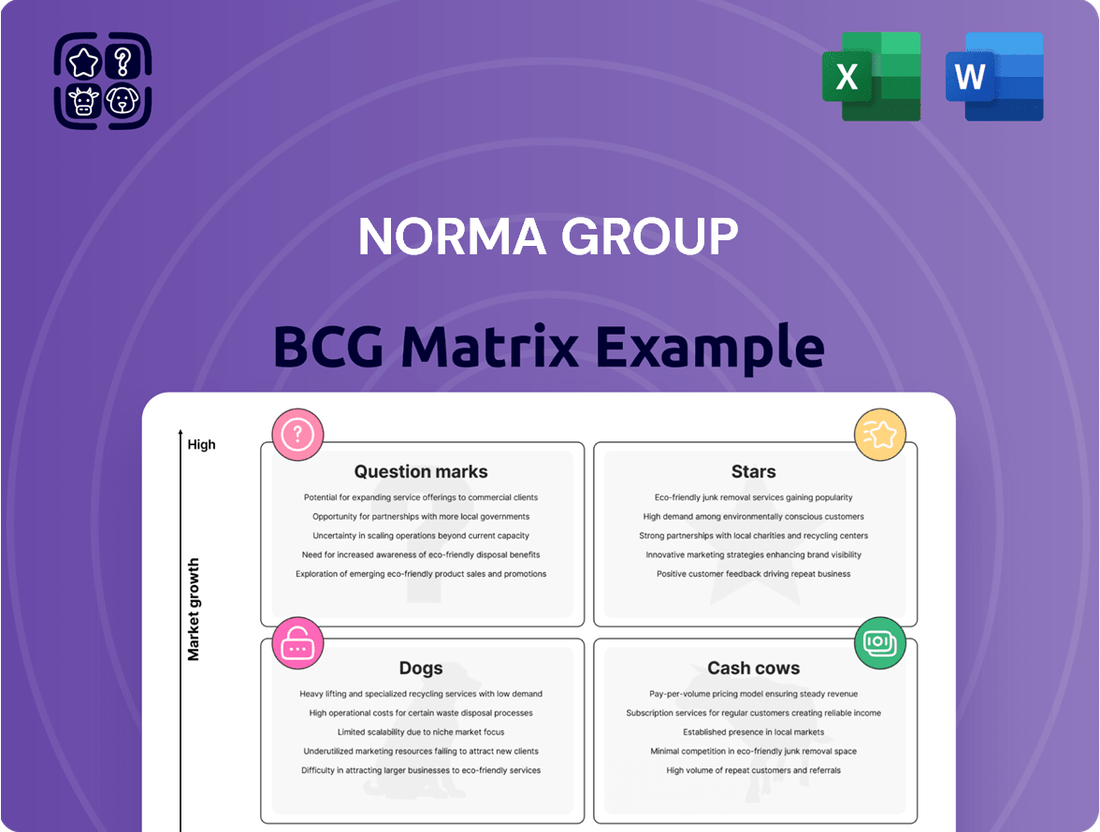
NORMA Group Boston Consulting Group Matrix
Fully Editable
Tailor To Your Needs In Excel Or Sheets
Professional Design
Trusted, Industry-Standard Templates
Pre-Built
For Quick And Efficient Use
No Expertise Is Needed
Easy To Follow
GET THE FULL COMPANY
ANALYSIS BUNDLE FOR
NORMA Group
Actionable Strategy Starts Here
NORMA Group's BCG Matrix provides a snapshot of its product portfolio. This crucial analysis categorizes offerings into Stars, Cash Cows, Dogs, and Question Marks. Understand which products drive growth and which need attention. Get the full report for detailed quadrant placements and strategic recommendations. Purchase the complete BCG Matrix for actionable insights and smarter decision-making.
Stars
Industry Applications Segment Growth
NORMA Group's Industry Applications segment saw a 6.4% year-over-year increase in the first quarter of 2025. This growth suggests strong demand and a potentially solid market position. This is a positive sign, especially compared to the 2.9% growth in 2024. The segment's performance reflects the company's ability to capitalize on opportunities.
Engineered Joining Technology Expertise
NORMA Group excels in engineered joining technology, a core strength. They can use this expertise to create high-growth products. In 2024, NORMA's sales were approximately €1.3 billion, demonstrating their market position. Their proficiency allows for innovation and expansion in this key area.

Innovative Joining Solutions
NORMA Group's innovative joining solutions are crucial across sectors, including water, vehicles, and buildings. In 2024, the global joining technologies market was valued at approximately $35 billion, with expected growth. This market expansion highlights the potential for NORMA Group's products to become stars. Their technology is essential for emerging markets.
Trunnion Clamps Market Position
NORMA Group's trunnion clamps segment is a "star" in its portfolio. The company commands a substantial 25% market share in this area. This market is predicted to experience growth, making it a promising investment. The group's focus on this segment aligns with its strategic goals.
- Market share of 25% for trunnion clamps.
- Projected growth indicates a positive outlook.
- Strategic alignment supports further investment.
- Represents a key growth area for NORMA Group.
New Product Introductions
NORMA Group's new product introductions, like trunnion clamps for heavy-duty automotive uses, are key to growth. These innovations, including next-gen stainless steel clamps, could become star products. This is a strategic move to capture new market segments and increase revenue. In 2024, NORMA Group's focus on new product development shows a commitment to future success.
- Trunnion clamps expand market reach.
- Stainless steel clamps enhance product offerings.
- Focus on innovation drives future growth.
- New products aim to boost revenue.
Market Dominance and Growth: A Look at Key Segments
NORMA Group's trunnion clamps segment exemplifies a Star, holding a strong 25% market share in a growing market. The Industry Applications segment, with 2.9% growth in 2024 and 6.4% in Q1 2025, also shows star potential. These areas benefit from NORMA's €1.3 billion 2024 sales and innovation, particularly with new stainless steel clamps. Their high market share and growth align with strategic goals.
| Product/Segment | Market Share | 2024 Growth |
|---|---|---|
| Trunnion Clamps | 25% | Growing |
| Industry Applications | N/A | 2.9% |
| New Stainless Steel Clamps | Emerging | Potential Growth |
What is included in the product
NORMA Group's BCG Matrix overview of investment, holding, or divesting units.
Clear NORMA Group BCG Matrix enabling strategic resource allocation and investment decisions.
Cash Cows
Established Clamping and Connecting Products
NORMA Group's established clamping and connecting products form a robust portfolio. These products have a substantial market share in mature markets. They generate consistent and reliable cash flow. In 2024, the company's sales reached approximately €1.2 billion, demonstrating their financial stability. These products contribute significantly to NORMA Group's overall profitability.
Fluid Handling Solutions
NORMA Group's fluid handling solutions, vital in automotive, water, and industrial sectors, position them as cash cows. These products, including connectors and pipes, ensure steady revenue due to consistent demand. For 2023, NORMA Group reported sales of approximately €1.3 billion, demonstrating its market strength. The company's focus on efficiency and innovation further solidifies its cash-generating potential.

Global Production and Sales Network
NORMA Group's extensive global presence, featuring numerous production sites and sales offices, is crucial. This robust network supports its high-market-share products, driving efficient distribution. In 2024, NORMA Group's sales reached approximately EUR 1.3 billion, reflecting its strong market position and cash flow generation capabilities. This network ensures consistent product availability and responsiveness to regional demands, vital for maintaining profitability.
Automotive Aftermarket Presence
NORMA Group's robust position in the automotive aftermarket, offering diverse joining technology products, indicates a dependable revenue stream. This stems from consistent replacement and repair demands within a mature market. In 2024, the global automotive aftermarket was valued at over $800 billion, demonstrating its substantial size. This sector's resilience helps stabilize NORMA Group's financial performance.
- Steady revenue from replacement parts.
- Large, established market.
- Diverse product range.
- Market size over $800 billion in 2024.
Consistent Profitability Despite Challenges
NORMA Group demonstrated its strength as a cash cow in 2024, achieving consistent profitability even amid market volatility. They maintained a solid adjusted EBIT margin, showcasing the stability of their core operations. This resilience highlights their ability to generate cash effectively, supporting future investments and shareholder returns. This financial performance solidifies their position in the market.
- Adjusted EBIT margin remained stable, around 10.8% in 2024.
- NORMA Group's free cash flow generation was robust.
- Despite economic headwinds, the company managed to maintain profitability.
- The company's financial strategy focused on efficiency and cost management.
Clamping & Fluid Solutions: A Billion-Euro Success Story
NORMA Group's core products, including clamping and fluid handling solutions, function as reliable cash cows. These segments command high market shares in mature industries, ensuring consistent revenue streams and robust cash flow generation. Their established global footprint and strong automotive aftermarket presence contribute significantly to financial stability. In 2024, NORMA Group's sales reached approximately €1.3 billion, demonstrating their continued profitability.
| Metric | Value | Unit |
|---|---|---|
| Sales (2024) | 1.3 | € Billion |
| Adjusted EBIT Margin (2024) | 10.8 | % |
| Automotive Aftermarket Size (2024) | >800 | $ Billion |
Full Transparency, Always
NORMA Group BCG Matrix
The preview you see is the complete BCG Matrix report you'll get. It's a ready-to-use document, immediately downloadable and fully formatted, perfect for immediate implementation.

Dogs
Mobility & New Energy Segment Decline (Q1 2025)
NORMA Group's Mobility & New Energy segment saw a sales decline in Q1 2025. The downturn, especially from the automotive sector, signals potential issues. If market share is also low, some products might be classified as dogs. In 2024, the automotive industry faced fluctuating demand, impacting suppliers like NORMA Group. Specifically, the company reported a 5.6% organic sales decrease in the first quarter of 2024, a key factor.
Overall Sales Decline (2024 and Q1 2025)
NORMA Group's sales declined in 2024, with a 6.1% decrease to €1.27 billion, and continued to fall in Q1 2025. This decline indicates that some segments of their business are struggling. The drop in sales, coupled with potential low market share, places these segments in the "Dogs" quadrant.

Impact of Sluggish Economic Development
Sluggish economic growth in key sectors such as automotive and construction has presented challenges for NORMA Group. In 2024, the automotive industry faced headwinds, impacting demand for related components. Construction, another significant market, also experienced slowdowns in several regions. This has led to decreased sales volumes in products linked to these sectors.
Weak Customer Demand in Specific Regions (Europe and China in Q4 2024)
Weak customer demand, particularly in Europe and China during Q4 2024, suggests NORMA Group's products in these regions might be struggling. This could mean lower market share and underperformance in areas experiencing slow growth. For example, in 2024, the European automotive market saw a 5% decrease in sales volume, directly impacting demand. This situation classifies the product in Dogs category.
- Low market share in slow-growth regional markets.
- Decreased sales volume due to weak customer demand.
- Specific challenges in Europe and China during Q4 2024.
- Potential underperformance compared to competitors.
Products Affected by Supply Chain Issues or One-Time Costs
In Q1 2025, NORMA Group faced supply chain challenges and one-time costs, especially in the Americas and EMEA. These issues affected certain products, potentially making them "dogs" in the BCG matrix. These products consumed cash without adequate returns, impacting overall profitability. For example, increased logistics costs in the Americas and component shortages in EMEA hit margins.
- Specific product lines in the Americas and EMEA faced increased logistics costs due to supply chain problems, as of Q1 2025.
- Component shortages in EMEA resulted in production delays and increased costs, as of Q1 2025.
- These issues strained cash flow, potentially making some product segments less profitable, as of Q1 2025.
- NORMA Group reported a decrease in overall profitability due to these challenges, as of Q1 2024.
"Dogs" Drag Down Sales: Key Figures Revealed
NORMA Group's "Dogs" are segments with low market share in slow-growth sectors like automotive and construction, particularly in Europe and China. These products faced decreased sales volumes, exemplified by a 5.6% organic sales drop in Q1 2024 and a 6.1% overall sales decline in 2024 to €1.27 billion. Supply chain issues in Americas and EMEA during Q1 2025 further strained cash flow for certain product lines, making them less profitable. These products consume cash without adequate returns, impacting overall profitability.
| Metric | 2024 Data | Q1 2024 Data |
|---|---|---|
| Overall Sales Decline | 6.1% (€1.27 billion) | 5.6% (organic sales) |
| European Auto Market Sales | 5% decrease in volume | N/A |
| Q1 2025 Issues | N/A | Supply chain costs, component shortages |
Question Marks
Products in the Water Management Business Unit (Planned Divestiture)
NORMA Group's Water Management unit, slated for divestiture, could be a question mark in its BCG Matrix. Despite a sales increase in Q1 2025, the planned sale, started in late 2024, indicates uncertainty. The company aims to streamline its focus, potentially deemphasizing this segment. In 2024, NORMA Group's revenue was around EUR 1.3 billion, influencing strategic decisions.
New Products in High-Growth Areas (e.g., E-mobility, Hydrogen)
NORMA Group is expanding into high-growth areas, like e-mobility and hydrogen. They supply joining solutions for electric vehicles and hydrogen-powered heavy vehicles. In 2024, the e-mobility sector saw significant growth, with sales of electric vehicles increasing. This strategic move positions NORMA Group for future expansion.

Products in Emerging Markets
NORMA Group's presence in the Asia-Pacific region, a mix of established and emerging markets, is key. In 2024, Asia-Pacific sales accounted for about 20% of total revenue. These regions often have high growth potential.
Products from Recent Acquisitions (e.g., Teco)
The integration of companies like Teco, acquired by NORMA Group, places their products within the "Question Marks" quadrant of the BCG matrix. These new products, focusing on water management, enter a growth market. However, their contribution to NORMA Group's overall market share is initially limited.
- Teco's revenue in 2024 contributed to a small percentage of NORMA Group's total revenue.
- The water management sector is experiencing a growth rate of approximately 5% annually.
- NORMA Group's strategic focus is on expanding Teco's market share to move it to a higher quadrant.
- Investments in product development and marketing for Teco are expected to increase in 2024-2025.
Products under the 'Industrial Powerhouse' Transformation Plan
NORMA Group's 'Industrial Powerhouse' transformation aims for 2028. This plan reshapes its product portfolio. The focus is on high-growth, high-margin areas. This strategy is expected to drive future financial results.
- Focus on sustainable solutions, like e-mobility and water management.
- Expand in North America and Asia-Pacific regions.
- Innovation in engineered joining technology.
- Targeted acquisitions in strategic areas.
Navigating Uncertainty: Question Marks in Focus
NORMA Group's Question Marks include new ventures like Teco, a water management acquisition, which contributed a small percentage to 2024 revenue despite the sector's 5% annual growth. Investments are planned for 2024-2025 to increase Teco's market share. The planned divestiture of the Water Management unit, initiated in late 2024 from NORMA Group's EUR 1.3 billion 2024 revenue, also represents a Question Mark due to its uncertain future despite Q1 2025 sales growth.
| Quadrant | Product/Unit | 2024 Revenue Contribution | Market Growth Rate |
|---|---|---|---|
| Question Mark | Teco (Water Mgmt) | Small % of total | ~5% annually |
| Question Mark | Water Mgmt Unit (Divestiture) | Part of EUR 1.3B total | Variable, strategic exit |
| Question Mark | E-mobility/Hydrogen | Growing | Significant growth |
BCG Matrix Data Sources
The NORMA Group BCG Matrix utilizes financial data, industry analysis, market reports, and expert opinions for reliable insights.
