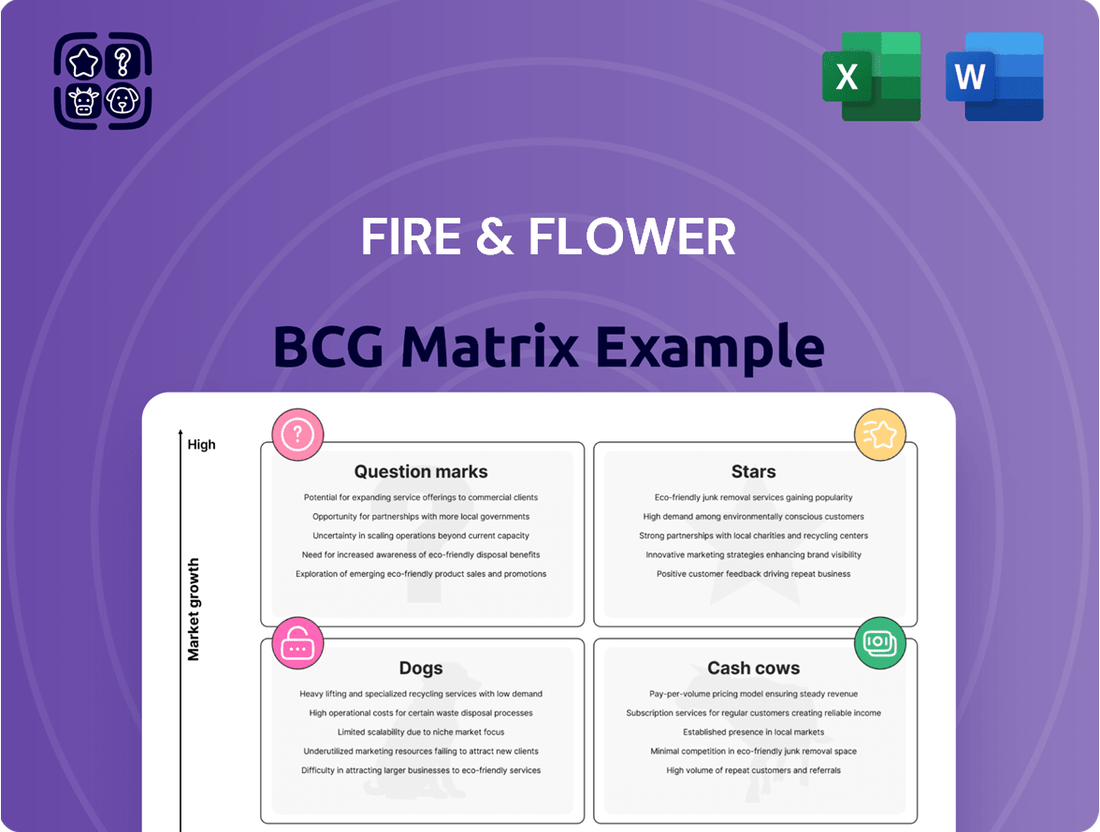
Fire & Flower Boston Consulting Group Matrix
Fully Editable
Tailor To Your Needs In Excel Or Sheets
Professional Design
Trusted, Industry-Standard Templates
Pre-Built
For Quick And Efficient Use
No Expertise Is Needed
Easy To Follow
GET THE FULL COMPANY
ANALYSIS BUNDLE FOR
Fire & Flower
See the Bigger Picture
Curious about Fire & Flower's strategic product positioning? This glimpse into their BCG Matrix highlights key areas like their potential "Stars" and "Cash Cows."
Unlock the full picture by purchasing the complete BCG Matrix report. It offers a comprehensive breakdown of all their product categories, revealing which are poised for growth and which may require a strategic rethink.
Don't miss out on actionable insights that can inform your own business strategies. Get the full report today and gain a competitive edge by understanding Fire & Flower's market dynamics.
Stars
Hifyre Digital Platform
Fire & Flower's Hifyre™ digital platform, encompassing Hifyre IQ™ and Hifyre ONE™, was recognized as a premier real-time sales data analysis and retail software solution tailored for the cannabis sector. This sophisticated platform provided deep insights into consumer habits, product success, and market dynamics, designed to enhance both customer engagement and operational efficiency.
In the fast-changing, data-intensive cannabis industry, a robust data analytics platform with a significant market footprint is a strong contender for a Star in the BCG matrix. Such a platform delivers crucial intelligence that extends beyond the capabilities of physical retail locations, offering a competitive edge.
Strategic Data Insights
The Hifyre platform's predictive analytics offer a significant strategic advantage, enabling businesses to forecast sales, product potency, format, and pricing trends. This foresight is invaluable in the dynamic cannabis market, helping companies anticipate shifts and maintain a competitive edge.
By providing these forward-looking insights, Hifyre positions itself as a high-value service in a high-growth sector. Its potential to capture substantial market share in cannabis data analytics is considerable, especially if other industry participants adopt similar data-driven strategies.
For instance, in 2024, the global legal cannabis market was projected to reach over $70 billion, highlighting the immense growth potential for data analytics services that can navigate this complex landscape. Companies leveraging such platforms are better equipped to optimize their product development and marketing strategies.

Innovation in Retail Technology
Fire & Flower's Hifyre ONE™ platform exemplifies innovation in retail technology, offering a data-driven approach to personalize customer interactions. This software integrates e-commerce, click-and-collect, in-store menus, and kiosk functionalities, aiming to boost engagement and streamline operations within the developing cannabis market.
The cannabis retail sector is a rapidly evolving landscape, and technological advancements are crucial for competitive advantage. Fire & Flower's strategic investment in Hifyre positions them to capitalize on this high-growth area, driving efficiency and customer loyalty through advanced retail solutions.
Spark Perks Member Program
The Hifyre SPARK™ program is a significant asset for Fire & Flower, functioning as Canada's largest cannabis loyalty program with over 100,000 members. This extensive program offers invaluable insights into detailed consumer behaviors and preferences within the burgeoning Canadian cannabis market, which is anticipated to reach CAD 8.5 billion by 2025.
A substantial and actively engaged loyalty program in a rapidly expanding sector like Canadian cannabis is a powerful tool for fostering repeat business and gathering crucial data for market leadership. The program's robust customer base and the data it generates are poised to be a major catalyst for growth.
- Loyalty Program Size: Over 100,000 members, making it Canada's largest cannabis loyalty program.
- Market Context: Operates within the Canadian cannabis market, projected to reach CAD 8.5 billion by 2025.
- Strategic Value: Provides deep understanding of consumer behavior and preferences.
- Growth Driver: Expected to drive repeat business and offer data for market dominance.
Potential for Platform Licensing
Fire & Flower's Hifyre platform represents a significant opportunity for platform licensing. Beyond its own retail footprint, the company offered strategic licensing support, showcasing the Hifyre technology's potential as a standalone product. This could allow other retailers to leverage advanced retail and data solutions, tapping into a wider market need.
If this licensing model achieves substantial adoption, it could position Hifyre as a high-growth, high-market share offering, independent of Fire & Flower's physical store performance. This diversification strategy is crucial for maximizing the platform's value.
- Hifyre Platform Licensing: Fire & Flower's Hifyre technology is positioned for licensing to other cannabis retailers.
- Market Need: Addresses the broader market's demand for advanced retail and data solutions.
- Growth Potential: A successful licensing model could lead to high growth and significant market share.
- Strategic Value: Offers an independent revenue stream, diversifying beyond physical retail operations.
Cannabis Tech: A Star in a Booming Market
The Hifyre platform, including its data analytics and loyalty program, clearly fits the Star category. It operates in a high-growth sector, the global legal cannabis market, which was projected to exceed $70 billion in 2024. Its substantial user base, over 100,000 members in the Hifyre SPARK™ loyalty program, and its potential for licensing to other retailers indicate a strong market share and significant future growth prospects.
| Aspect | Description | Market Growth (2024) | Market Share Indicator |
|---|---|---|---|
| Hifyre Platform | Advanced retail and data analytics for cannabis. | Global legal cannabis market projected >$70 billion. | Potential for broad adoption via licensing. |
| Hifyre SPARK™ | Canada's largest cannabis loyalty program. | Canadian cannabis market projected CAD 8.5 billion by 2025. | Over 100,000 members, indicating strong user engagement. |
What is included in the product
This BCG Matrix analysis categorizes Fire & Flower's business units, identifying growth opportunities and areas for strategic resource allocation.
A clear visual of Fire & Flower's business units, highlighting growth opportunities and areas needing strategic attention.
Cash Cows
Established Canadian Retail Network
Fire & Flower's established Canadian retail network, at its peak, encompassed over 90 corporate-owned cannabis stores nationwide. These physical locations, strategically positioned in key markets, historically served as the company's primary revenue generators.
This extensive footprint allowed Fire & Flower to capture a significant share of the burgeoning Canadian cannabis market, contributing to consistent cash flow. For instance, in its fiscal year 2021, the company reported total revenue of $174.8 million, with its retail operations forming the backbone of this figure, despite later facing financial challenges.
Early Market Dominance in Key Provinces
Fire & Flower's early strategy focused on securing prime retail locations in provinces with more favorable licensing, such as Alberta. This allowed them to build a substantial market presence before competitors entered in full force. By 2020, Fire & Flower operated over 50 stores in Alberta alone, demonstrating their early dominance in a key market.

Operational Efficiency in Mature Stores
Fire & Flower's most successful and well-managed stores likely exhibit strong operational efficiency, leading to robust profit margins and consistent cash flow. These mature locations, having optimized their operations and built loyal customer bases, require minimal additional investment for growth. For instance, in 2024, Fire & Flower reported a notable improvement in its retail gross margin, a testament to the efficiency gains in its established store network.
Brand Recognition in Core Markets
Fire & Flower's strong brand recognition in core Canadian markets, cultivated through its extensive retail footprint and early market entry, positions it as a potential cash cow. This established brand loyalty in mature segments of the cannabis market could continue to attract a consistent customer base, reducing the reliance on costly marketing efforts.
For instance, by late 2023, Fire & Flower operated over 100 retail locations across Canada, a significant presence that fostered widespread consumer awareness. This broad reach allowed for sustained revenue generation from repeat customers, a hallmark of a cash cow business unit.
- Brand Recognition: Fire & Flower achieved substantial brand recognition across Canada due to its early market entry and widespread retail presence.
- Customer Loyalty: This recognition translated into strong brand loyalty among Canadian cannabis consumers, particularly in established market segments.
- Revenue Stability: The loyalty ensures a consistent revenue stream, minimizing the need for extensive marketing expenditures, characteristic of a cash cow.
- Market Position: By the end of 2023, Fire & Flower's network of over 100 retail stores underscored its established presence and ability to generate predictable income.
Initial Strategic Partnerships
Fire & Flower's initial strategic partnership with Alimentation Couche-Tard was designed to establish a robust retail presence. This collaboration aimed to capitalize on Couche-Tard's vast network of convenience stores, creating a stable and high-volume sales channel. The goal was to transform these co-located stores into reliable revenue generators, essentially functioning as cash cows for Fire & Flower.
The strategic investment from Couche-Tard, which included a significant capital injection, was intended to fuel the growth of these joint ventures. While the partnership eventually ended due to Fire & Flower's financial difficulties, the initial setup of co-located stores represented a key effort to build a strong foundation for consistent sales. This strategic move was a critical component in Fire & Flower's early business model, aiming to generate predictable income streams.
- Partnership Goal: To leverage Couche-Tard's retail infrastructure for high-volume sales.
- Financial Impact: Aimed to create stable, cash-generating retail channels.
- Outcome: Partnership dissolved due to Fire & Flower's financial distress.
- Strategic Intent: Establish a foundation for consistent revenue through co-located stores.
Fire & Flower's Retail Powerhouses: Stable Revenue Streams
Cash cows within Fire & Flower's portfolio represent its mature, high-performing retail locations that generate consistent, predictable revenue with minimal investment. These stores benefit from established brand recognition and customer loyalty, ensuring stable sales volumes. By late 2023, Fire & Flower operated over 100 retail locations, with many of these prime spots functioning as reliable income generators.
| Metric | 2023 (Approx.) | 2024 (Guidance/Recent Data) |
|---|---|---|
| Number of Stores | 100+ | Maintained or slight growth in core markets |
| Retail Gross Margin | Improved | Continued focus on efficiency gains |
| Revenue Contribution | Significant | Stable to growing from established locations |
Preview = Final Product
Fire & Flower BCG Matrix
The Fire & Flower BCG Matrix preview you are viewing is the identical, fully completed document you will receive upon purchase, offering a clear strategic overview of their product portfolio. This comprehensive analysis, meticulously prepared, will be delivered to you without any watermarks or placeholder content, ensuring immediate professional utility. You are seeing the exact, ready-to-use BCG Matrix report that will be downloadable, allowing for instant integration into your business strategy discussions and planning. This is not a sample; it's the final, polished BCG Matrix for Fire & Flower, designed for actionable insights and strategic decision-making.

Dogs
Underperforming Retail Store Portfolio
Fire & Flower's retail stores, despite contributing significantly to gross revenue, are a clear example of Dogs in the BCG Matrix. In Q1 2023, this segment generated about 75% of the company's gross revenue, but it was also the main reason for substantial operating losses. This suggests many of these locations are struggling in less profitable areas or with low market penetration.
The Canadian cannabis retail market has become increasingly competitive, with price wars impacting margins. This environment makes it difficult for stores with weaker market positions to cover their operational expenses, leading to the underperformance seen in Fire & Flower's portfolio. The company's extensive network, while a potential strength, is currently weighed down by these underperforming assets.
Accumulated Net Losses and Debt
Fire & Flower's financial performance paints a concerning picture, with accumulated net losses exceeding CA$200 million since 2018. The company reported a significant net loss of CA$89.5 million for its 2022 fiscal year, a trend that saw its cash positions steadily decline.
These ongoing financial difficulties suggest that the broader business operated as a cash trap, a situation where more capital was being spent than earned. This persistent drain on resources, despite potential successes in specific areas, positions the overall entity as a 'Dog' within a strategic framework, indicating a low market share and low growth potential.

Ineffective Turnaround Efforts
Fire & Flower's attempts at a turnaround, including a formal restructuring and seeking creditor protection under the CCAA in June 2023, proved unsuccessful. Despite exploring strategic options and trying to secure more financing, the company was ultimately acquired by Fika Cannabis. This outcome highlights a classic 'Dogs' scenario in the BCG Matrix, where significant investment failed to alter the company's declining performance.
Impact of Market Saturation and Competition
The Canadian cannabis market faced significant headwinds in 2024, characterized by a noticeable slowdown in growth and intensified competition. This environment led to widespread price pressures, directly impacting the revenues of companies operating within the sector. Annual sales figures for the Canadian cannabis market in 2024 reflected this downturn, indicating a contraction compared to previous periods.
Fire & Flower, with its substantial retail footprint across Canada, found itself particularly exposed to these challenging market conditions. The company's strategy of broad expansion meant many of its locations operated with a low market share in an increasingly saturated retail landscape. This vulnerability was exacerbated by the prevailing price pressures, rendering a significant portion of its operations unprofitable.
- Market Growth Slowdown: The Canadian cannabis market experienced a deceleration in its growth trajectory throughout 2024.
- Increased Competition: A surge in new entrants and existing players intensified competition, putting pressure on market share.
- Price Erosion: Competitive pressures and oversupply led to significant price declines for cannabis products, impacting profitability.
- Fire & Flower's Vulnerability: The company's extensive retail network, coupled with a low market share in saturated regions, made it susceptible to these negative market dynamics, resulting in unprofitable store operations.
Divested Assets and Loss of Ownership
Fire & Flower's journey culminated in the divestiture of its assets, with Fika Cannabis ultimately acquiring them. This move saw the cancellation of previous securities, and Alimentation Couche-Tard exited its ownership stake, having incurred substantial losses estimated in the millions. This scenario perfectly illustrates the typical outcome for a 'Dog' business unit in the BCG matrix – an entity that is sold or liquidated due to its persistent failure to generate profitable returns.
- Alimentation Couche-Tard's Exit: The company ceased its ownership after significant financial losses, highlighting the underperformance of the divested assets.
- Fika Cannabis Acquisition: The ultimate transfer of Fire & Flower's assets to Fika Cannabis marked the final stage of divestment.
- Securities Cancellation: Previous securities related to the divested assets were rendered void, reflecting the complete loss of ownership for prior stakeholders.
- 'Dog' Classification: This outcome aligns with the characteristics of a 'Dog' in the BCG matrix, signifying an unprofitable business unit that is typically sold off.
Cannabis Retail's Downfall: A Financial Analysis
Fire & Flower's retail operations, representing the majority of its revenue, were categorized as Dogs in the BCG Matrix due to their low market share and low growth prospects. Despite generating approximately 75% of gross revenue in Q1 2023, these stores incurred substantial operating losses, indicating poor profitability. The company's extensive network struggled against intense competition and price wars in the Canadian cannabis market, a trend that persisted through 2024 with a notable slowdown in market growth and continued price erosion.
The company's financial performance underscored this 'Dog' classification, with accumulated net losses exceeding CA$200 million since 2018 and a net loss of CA$89.5 million reported for fiscal year 2022. This situation led to Fire & Flower being described as a cash trap, ultimately resulting in its acquisition by Fika Cannabis, with Alimentation Couche-Tard exiting its investment after significant losses.
| Metric | Value (Approx.) | Year |
|---|---|---|
| Gross Revenue Contribution (Retail) | 75% | Q1 2023 |
| Accumulated Net Losses | > CA$200 million | Since 2018 |
| Net Loss (Fiscal Year) | CA$89.5 million | 2022 |
| Market Growth (Canadian Cannabis) | Slowdown | 2024 |
Question Marks
U.S. Expansion through Licensing Agreements
Fire & Flower's strategy to enter the U.S. cannabis market via licensing, notably with American Acres Managers (which became Fire & Flower U.S. Holdings), positioned it within the Question Mark category of the BCG Matrix. This approach aimed to capitalize on the U.S.'s substantial growth prospects by leveraging its established brand and the Hifyre digital platform.
The U.S. cannabis market presented a compelling high-growth opportunity, but Fire & Flower's presence and market share within it were still in early stages as of 2024. This nascent penetration in a rapidly expanding sector aligns with the characteristics of a Question Mark, indicating potential for significant future growth but requiring careful strategic investment and development.
Exploration of Emerging Product Categories
Emerging product categories like concentrates, topicals, and beverages represent potential Stars for Fire & Flower. While specific company data isn't public, the Canadian cannabis market saw significant growth in these areas. For instance, by Q3 2024, the edibles and beverages segment alone accounted for over $200 million in sales, indicating strong consumer adoption.
Fire & Flower's strategic focus on these nascent segments, even with substantial upfront investment, could position them for future market leadership. The high growth potential, coupled with increasing consumer acceptance of alternative cannabis formats, makes these categories a crucial area for development and market penetration.

International Market Exploration (Beyond US)
Fire & Flower's exploration into international markets beyond Canada and the US, particularly in regions with growing acceptance of cannabis, signifies a strategic move into potential high-growth areas.
These new territories, where the company likely has minimal to no existing market share, would position them as Stars in the BCG matrix, requiring significant investment to capture nascent demand and build brand presence.
For instance, by mid-2024, the global legal cannabis market was projected to reach over $30 billion, with significant growth anticipated in Europe and Australia, presenting prime examples of such international opportunities.
Strategic Partnerships for New Channels
Prior to its restructuring, Fire & Flower explored strategic partnerships for new channels, aiming to expand beyond its core retail operations. These nascent collaborations, not yet scaled to significant market share, represented potential high-growth opportunities but carried inherent uncertainty, placing them in the Stars category of the BCG Matrix.
For instance, in 2024, Fire & Flower was reportedly exploring partnerships with various entities, including potential collaborations within the cannabis tourism sector or with technology providers for enhanced online sales capabilities. These ventures, while promising, were in their early stages, with their ultimate market impact yet to be determined.
- Exploration of new distribution channels: Fire & Flower sought to diversify its reach beyond brick-and-mortar stores.
- Nascent collaborations: Partnerships were in early development, lacking proven market traction.
- High-growth potential with uncertainty: These ventures targeted promising markets but faced an uncertain future.
- Example: Potential partnerships in cannabis tourism or online sales technology in 2024.
Adaptation to Evolving Regulatory Landscape
The Canadian cannabis sector is poised for regulatory shifts, potentially impacting product types and potency. Fire & Flower's capacity to swiftly introduce new, compliant offerings ahead of competitors in these evolving frameworks is crucial. For instance, if new regulations permit higher THC concentrations, Fire & Flower's ability to quickly develop and market products exceeding current limits, while adhering to all new guidelines, would be a significant differentiator. This agility is key to securing early market share in emerging product categories.
Navigating these regulatory changes demands substantial investment and operational flexibility. Successfully launching compliant products and services in response to evolving rules, such as potential changes to edibles or beverage regulations, demonstrates Fire & Flower's adaptive capacity. For example, the company's ability to pivot its product development pipeline to meet new provincial testing requirements or labeling standards, as seen with the introduction of new vape product regulations in 2023, showcases this adaptability.
- Agility in Product Development: Fire & Flower's success hinges on its speed in adapting its product portfolio to meet new regulatory requirements, such as potential changes to potency limits or new product categories.
- Investment in Compliance: Capturing market share in a dynamic regulatory environment necessitates significant investment in research, development, and operational adjustments to ensure full compliance with evolving laws.
- First-Mover Advantage: Establishing market leadership in new product categories or service models introduced through regulatory changes provides a distinct competitive edge.
- Market Share Capture: The ability to quickly respond to and capitalize on regulatory shifts is directly linked to Fire & Flower's potential to grow its market share in an increasingly complex landscape.
Fire & Flower: Navigating the Question Mark Zone
Fire & Flower's initial foray into the U.S. market, particularly through licensing agreements, placed it squarely in the Question Mark category of the BCG Matrix. This strategic move aimed to tap into the high-growth potential of the U.S. cannabis sector, leveraging its existing brand and digital platform, Hifyre.
The U.S. cannabis market, while offering substantial growth prospects, represented an area where Fire & Flower's market share was still developing as of 2024. This early-stage penetration in a rapidly expanding industry is characteristic of a Question Mark, highlighting both potential and the need for strategic investment.
The company's expansion into international markets beyond Canada and the U.S. also positions it within this category. These new territories, where Fire & Flower likely had minimal to no existing market share in 2024, presented high-growth opportunities but also carried significant uncertainty, demanding investment to build brand presence and capture nascent demand.
Fire & Flower's exploration of new distribution channels and strategic partnerships, such as those in cannabis tourism or online sales technology in 2024, also fell into the Question Mark quadrant. These ventures, while promising for future growth, were in their nascent stages with unproven market traction.
| BCG Category | Fire & Flower's Position | Market Characteristic | Strategic Implication |
|---|---|---|---|
| Question Mark | U.S. Market Entry (Licensing) | High Growth, Low Share (as of 2024) | Requires significant investment to gain market share. |
| Question Mark | International Expansion (New Territories) | High Growth, Low Share (as of 2024) | Needs strategic investment to build brand and capture demand. |
| Question Mark | Nascent Partnerships (e.g., Tourism, Tech) | High Growth Potential, High Uncertainty | Investment needed to prove viability and scale. |
BCG Matrix Data Sources
Our BCG Matrix is constructed using robust data from financial filings, market research reports, and internal sales performance metrics to provide a comprehensive view of Fire & Flower's portfolio.
