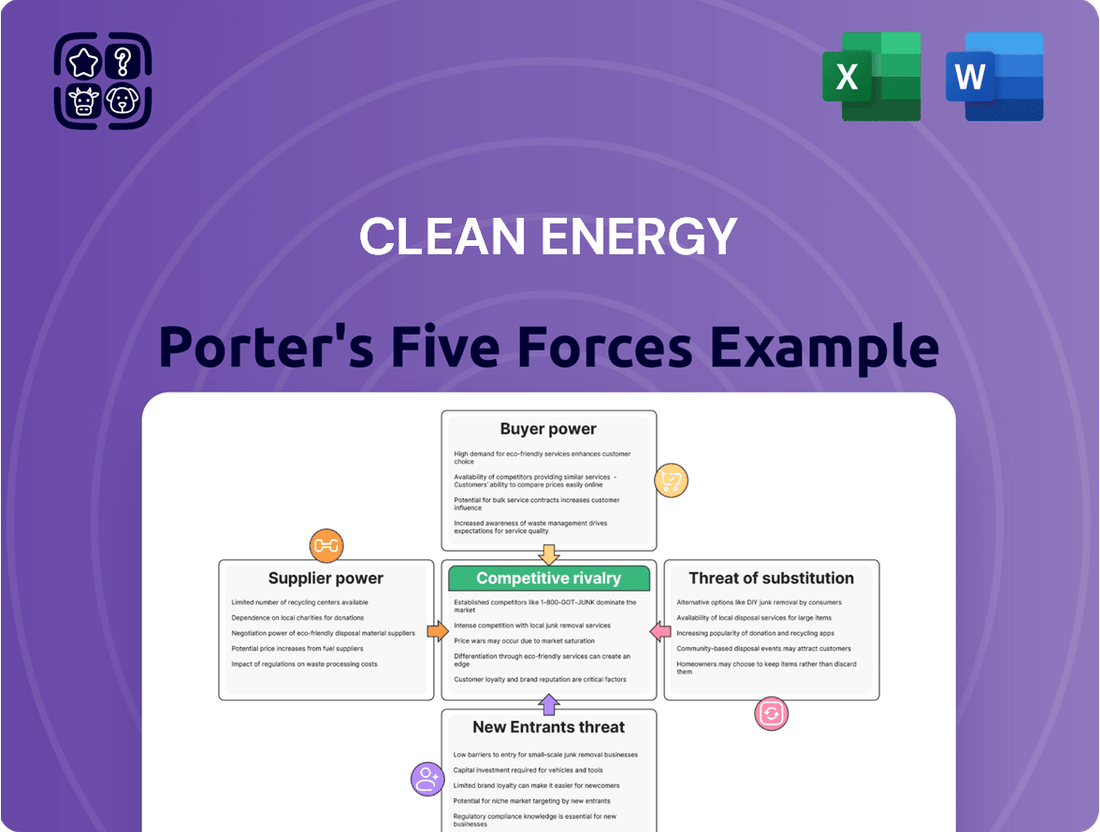
Clean Energy Porter's Five Forces Analysis
Fully Editable
Tailor To Your Needs In Excel Or Sheets
Professional Design
Trusted, Industry-Standard Templates
Pre-Built
For Quick And Efficient Use
No Expertise Is Needed
Easy To Follow
GET THE FULL COMPANY
ANALYSIS BUNDLE FOR
Clean Energy
Elevate Your Analysis with the Complete Porter's Five Forces Analysis
Understanding the competitive landscape is crucial for success in the dynamic Clean Energy sector. A Porter's Five Forces analysis reveals the underlying pressures that shape profitability, from the bargaining power of suppliers and buyers to the threat of new entrants and substitutes.
The complete report reveals the real forces shaping Clean Energy’s industry—from supplier influence to threat of new entrants. Gain actionable insights to drive smarter decision-making.
Suppliers Bargaining Power
Concentration of RNG Feedstock Suppliers
The bargaining power of suppliers for renewable natural gas (RNG) feedstock, like dairy farms and landfills, is a key factor for companies such as Clean Energy Fuels Corp. When there are only a limited number of sources for essential materials, these suppliers gain more control over pricing and contract conditions.
Clean Energy Fuels Corp. relies on external partnerships, including supply contracts and joint ventures, to secure a substantial portion of its RNG. This dependence on third-party sources means the company's ability to negotiate favorable terms is directly influenced by the concentration and leverage of its feedstock providers.
Uniqueness of RNG Feedstock
The specialized nature of renewable natural gas (RNG) feedstock significantly bolsters supplier bargaining power. While the raw materials like organic waste are widespread, the sophisticated infrastructure and technical know-how needed for methane capture and conversion into RNG are not universally available.
This scarcity of specialized processing capabilities means that suppliers with established RNG production facilities can command better terms. For companies like Clean Energy Fuels Corp., securing a consistent supply of high-quality RNG feedstock is crucial for meeting market demand and managing operational expenses, directly impacting their cost structure and competitive edge.

Switching Costs for Clean Energy Fuels Corp.
Clean Energy Fuels Corp. faces significant bargaining power from its renewable natural gas (RNG) suppliers due to high switching costs. These costs can involve the expense and time required to renegotiate supply agreements, modify existing fueling infrastructure to accommodate different RNG compositions or delivery methods, and conduct thorough due diligence on alternative suppliers to ensure reliability and quality. For instance, in 2023, the company reported capital expenditures related to station upgrades and expansions, highlighting the investment needed to adapt its network, which indirectly increases the stickiness of current supplier relationships.
Threat of Forward Integration by Suppliers
The threat of forward integration by suppliers in the renewable natural gas (RNG) sector can significantly impact companies like Clean Energy Fuels Corp. If RNG feedstock suppliers possess the capability or strong incentive to move downstream into RNG production and distribution, their bargaining power would naturally increase. This strategic move, known as forward integration, could potentially diminish Clean Energy Fuels Corp.'s market share and profitability by allowing suppliers to bypass them and capture more of the value chain. For instance, a large agricultural operation that generates significant biogas could invest in upgrading and distributing its own RNG, directly competing with established players.
However, several factors can mitigate this threat. The development and operation of fueling stations, a critical component of the downstream market for RNG, are highly capital-intensive. This substantial financial barrier can limit the ability of many feedstock suppliers to effectively integrate forward. Clean Energy Fuels Corp., with its established infrastructure and expertise in station development, holds an advantage in this regard. For example, building a single fueling station can cost millions of dollars, requiring significant upfront investment and ongoing operational expenses that not all feedstock producers can readily absorb.
- Forward Integration Risk: RNG feedstock suppliers moving into production and distribution increases their leverage, potentially reducing Clean Energy Fuels Corp.'s market share and margins.
- Capital Intensity Barrier: The high cost of developing and operating fueling stations acts as a significant deterrent for many feedstock suppliers considering forward integration.
- Infrastructure Advantage: Clean Energy Fuels Corp.'s existing network and expertise in station development provide a competitive moat against potential supplier integration.
Impact of Regulatory and Incentive Programs
Government policies and incentive programs, such as Renewable Identification Number (RIN) credits and Low Carbon Fuel Standard (LCFS) credits, directly impact the profitability of renewable natural gas (RNG) production. For instance, in 2023, the average RIN price for D3 (cellulosic) credits, relevant to RNG, saw fluctuations, with some periods exceeding $2.00 per gallon, significantly boosting supplier revenue. Changes in these policies can therefore profoundly influence the financial viability of RNG suppliers, directly affecting their bargaining power with downstream purchasers like Clean Energy Fuels Corp.
These regulatory frameworks create a dynamic environment where the bargaining power of RNG suppliers is closely tied to the market value and longevity of these credits. For example, a strong and stable demand for LCFS credits in California, a key market for Clean Energy Fuels, can empower suppliers to negotiate more favorable terms. Conversely, any reduction in credit values or program uncertainty can weaken their position.
- RIN Credit Impact: The value of RIN credits, particularly D3 credits for RNG, directly subsidizes production costs and enhances revenue streams for RNG suppliers, strengthening their negotiating leverage.
- LCFS Program Influence: California's LCFS program, a significant driver for RNG adoption, allows suppliers to capture additional revenue, making them less susceptible to price pressures from large offtakers.
- Policy Volatility: Shifts in federal or state incentive programs can introduce volatility, impacting supplier margins and consequently altering their bargaining power with customers.
RNG Supplier Power: Key Factors Driving Influence
The bargaining power of suppliers in the clean energy sector, particularly for renewable natural gas (RNG) feedstock, is significantly influenced by the concentration of suppliers and the specialized nature of production. Companies like Clean Energy Fuels Corp. often face suppliers who possess unique technical capabilities for methane capture and conversion, limiting the pool of viable alternatives and thus strengthening supplier leverage.
High switching costs also play a crucial role in empowering RNG feedstock suppliers. The expense and time involved in renegotiating contracts, adapting infrastructure, and vetting new providers make it challenging for companies to shift away from existing suppliers. For example, Clean Energy Fuels reported capital expenditures for station upgrades in 2023, indicating the investment required to maintain its network, which reinforces supplier relationships.
Government incentives, such as RIN and LCFS credits, directly impact supplier revenue and bargaining power. Strong demand and stable values for these credits, as seen with California's LCFS program, enhance suppliers' financial standing and their ability to negotiate favorable terms. For instance, D3 RIN credits, relevant to RNG, saw prices exceeding $2.00 per gallon at times in 2023, boosting supplier profitability.
| Factor | Impact on Supplier Bargaining Power | Example for Clean Energy Fuels Corp. (2023-2024 Data) |
|---|---|---|
| Supplier Concentration | High concentration leads to increased power. | Reliance on a limited number of dairy farms or landfills for RNG feedstock. |
| Specialized Production Capabilities | Scarcity of technical expertise strengthens supplier position. | Few entities possess the infrastructure for advanced methane capture and RNG conversion. |
| Switching Costs | High costs make it difficult to change suppliers. | Millions spent on station upgrades (2023 capex) to accommodate specific RNG sources. |
| Government Incentives (e.g., RINs, LCFS) | Stronger incentives increase supplier revenue and leverage. | D3 RIN prices over $2.00/gallon in 2023 boosted RNG producer margins. |
| Forward Integration Threat | Suppliers moving downstream increases their leverage. | Potential for large biogas producers to invest in distribution, bypassing intermediaries. |
What is included in the product
Analyzes the competitive intensity and attractiveness of the clean energy sector by examining supplier power, buyer power, threat of new entrants, threat of substitutes, and existing rivalry.
Instantly identify and mitigate competitive threats by visualizing the five forces impacting your clean energy strategy.
Customers Bargaining Power
Customer Concentration and Volume
Clean Energy Fuels Corp. has a broad customer spectrum, encompassing refuse, transit, shuttle, taxi, trucking, and municipal fleets. This diversity generally dilutes individual customer power, but the concentration of volume among key clients presents a different dynamic.
Large-volume customers, like major trucking companies or public transit authorities, hold considerable bargaining power. Their substantial fuel purchases mean they can demand more favorable pricing or contract terms, directly impacting Clean Energy Fuels' margins.
For instance, if a large transit agency representing a significant portion of a regional fueling station's volume were to negotiate, their ability to switch providers or demand lower prices would be substantial. This is a key consideration in managing customer relationships and pricing strategies within the clean energy sector.
Switching Costs for Customers
For vehicle fleets, transitioning away from natural gas to alternative fuel sources presents significant financial hurdles. These can include the substantial expense of replacing or modifying existing vehicles and the necessary overhaul of fueling infrastructure. These elevated switching costs effectively dampen the bargaining power of Clean Energy Fuels Corp.’s current customer base, making them less inclined to explore competitor offerings or entirely different fuel types.

Price Sensitivity of Customers
The price sensitivity of Clean Energy Fuels Corp.'s customers, particularly large commercial fleets, is a significant factor in their bargaining power. These operators are constantly evaluating the total cost of ownership, and the price of natural gas, especially renewable natural gas (RNG), compared to traditional diesel or other alternative fuels directly impacts their purchasing decisions.
For instance, if diesel prices remain low, the premium often associated with RNG can make it a harder sell, even with its environmental advantages. In 2023, while the average diesel price fluctuated, the cost of natural gas, including RNG, needed to remain competitive to drive widespread adoption among these cost-conscious fleets.
Availability of Alternative Fuels
The growing adoption of electric vehicles (EVs) and advancements in hydrogen fuel technology are significantly enhancing customer bargaining power within the clean energy sector. As these alternatives become more accessible and cost-competitive, consumers and businesses have a wider array of choices beyond traditional fuels.
This increased availability of substitutes means customers can more easily switch if pricing or service from Clean Energy Fuels Corp. is not satisfactory. For instance, by the end of 2023, the global EV market saw over 13.5 million new registrations, indicating a strong consumer shift towards alternatives.
- Increased EV Adoption: Over 13.5 million new electric vehicles were registered globally in 2023, offering a direct alternative to natural gas vehicles.
- Hydrogen Fuel Development: Significant investments are being made in hydrogen infrastructure, with government targets aiming for widespread availability by the late 2020s.
- Price Sensitivity: Customers can leverage the falling costs of renewable electricity and battery technology to negotiate better terms for alternative fuel solutions.
- Technological Advancements: Ongoing improvements in fuel efficiency and range for EVs and hydrogen vehicles reduce reliance on any single fuel provider.
Customer Information and Transparency
Customers' growing access to information, especially regarding fuel pricing and the availability of charging infrastructure, significantly boosts their bargaining power in the clean energy sector. This transparency empowers consumers to shop around, compare different renewable energy providers, and even negotiate better rates. For instance, by mid-2024, numerous online platforms and apps provided real-time data on electricity prices from various utility companies and detailed maps of EV charging stations, making it easier for consumers to make informed decisions.
The ability for customers to easily compare offerings, from the cost of solar panel installations to the price per kilowatt-hour for electric vehicle charging, directly translates into increased leverage. When consumers can readily identify cheaper or more convenient alternatives, companies are compelled to offer more competitive pricing and superior service to retain their customer base. This market transparency is a critical factor shaping the competitive landscape.
- Increased Information Access: Platforms offering real-time fuel pricing and charging station availability empower consumers.
- Enhanced Comparison Capabilities: Transparency allows customers to easily compare clean energy providers and negotiate terms.
- Impact on Pricing: Greater transparency can lead to more competitive pricing as companies vie for informed customers.
- Negotiating Power: Customers armed with information can negotiate more favorable contracts and service agreements.
Customer Power: Shaping Fuel Prices and Driving Alternative Adoption
While individual customers might have limited sway, large fleet operators for Clean Energy Fuels Corp. wield significant bargaining power due to their substantial fuel volumes. Their ability to negotiate favorable pricing and contract terms directly impacts company margins.
The increasing viability of electric vehicles (EVs) and hydrogen fuel presents customers with more alternatives, thereby strengthening their negotiating position. For example, over 13.5 million new EVs were registered globally in 2023, highlighting a growing shift away from traditional fuels.
Customers' enhanced access to information regarding fuel prices and charging infrastructure empowers them to compare offerings and negotiate better terms. This transparency compels companies to offer more competitive pricing to retain business.
| Customer Segment | Bargaining Power Factor | Impact on Clean Energy Fuels Corp. |
|---|---|---|
| Large Fleet Operators (e.g., trucking, transit) | High volume purchases, potential for switching | Pressure on pricing and contract terms |
| Small to Medium Fleets | Moderate volume, cost sensitivity | Price competitiveness is key for retention |
| Emerging Alternative Fuel Users (e.g., EV transition) | Growing choice of substitutes | Need to demonstrate cost-effectiveness and reliability |
Preview Before You Purchase
Clean Energy Porter's Five Forces Analysis
This preview shows the exact Clean Energy Porter's Five Forces Analysis you'll receive immediately after purchase—no surprises, no placeholders. This comprehensive document delves into the competitive landscape of the clean energy sector, detailing the intensity of rivalry, the bargaining power of buyers and suppliers, the threat of new entrants, and the impact of substitute products. You'll gain actionable insights into the strategic positioning and future outlook of this dynamic industry.

Rivalry Among Competitors
Number and Diversity of Competitors
The clean energy sector, particularly for transportation fuels, is characterized by a broad and varied competitive environment. Clean Energy Fuels Corp. faces competition not only from other natural gas providers but also from companies developing and promoting alternative fuels like renewable diesel and electric or hydrogen-based solutions.
This diversity means rivalry is intense. For instance, as of early 2024, the global electric vehicle market is rapidly expanding, with major automakers investing heavily in EV production, presenting a direct challenge to internal combustion engine-based fuel providers. Similarly, advancements in hydrogen fuel cell technology are gaining traction, with significant government and private sector funding supporting its development.
Industry Growth Rate
The renewable natural gas (RNG) and alternative fuels market is experiencing robust expansion, which directly impacts competitive rivalry. A rapidly growing market allows for more participants to enter and thrive, potentially softening direct competition as there's ample opportunity for all to increase their market share.
For instance, the global RNG market was valued at approximately $4.8 billion in 2023 and is projected to reach over $12 billion by 2030, demonstrating a compound annual growth rate (CAGR) of around 14.5%. This significant growth suggests that while competition exists, the expanding pie can accommodate new entrants and support the growth of existing players without necessarily intensifying head-to-head battles for market dominance.

Product Differentiation
Clean Energy Fuels Corp. stands out by concentrating on Renewable Natural Gas (RNG), a product offering substantial environmental advantages. For instance, dairy-derived RNG can achieve negative carbon intensity, a powerful differentiator in the clean energy market.
This strong focus on sustainability and emissions reduction helps to lessen the pressure of price-driven competition among players in the sector.
Exit Barriers for Competitors
High exit barriers in the clean energy sector, such as substantial investments in specialized manufacturing facilities or long-term power purchase agreements, can trap even struggling companies in the market. This situation often fuels persistent competitive rivalry, as firms are disinclined to cease operations despite financial headwinds.
For instance, the sheer scale of capital required for renewable energy projects, like offshore wind farms, creates significant sunk costs. These investments, often running into billions of dollars, make it economically unfeasible for many companies to simply walk away. As of early 2024, the average cost for a large-scale offshore wind farm can exceed $3 billion, illustrating the magnitude of these exit barriers.
- Significant Capital Investment: High upfront costs for specialized equipment and infrastructure, like solar panel manufacturing plants or battery storage facilities, deter easy exits.
- Long-Term Contracts: Power purchase agreements (PPAs) and supply contracts often lock companies into operations for decades, making early termination costly and difficult.
- Brand and Reputation: Companies may feel compelled to continue operations to protect their brand image and maintain relationships with stakeholders, even when unprofitable.
- Regulatory and Policy Commitments: Government incentives and regulatory frameworks can create obligations that are hard to shed, further increasing the difficulty of exiting the market.
Strategic Alliances and Joint Ventures
Strategic alliances and joint ventures in the clean energy sector significantly shape competitive rivalry. For instance, Clean Energy Fuels Corp. has partnered with major players like TotalEnergies and BP for renewable natural gas (RNG) production. These collaborations aim to bolster supply chains and broaden market access.
Such partnerships can have a dual effect on competition. They might intensify rivalry by fostering the growth of larger, more powerful entities capable of outmaneuvering smaller competitors. Conversely, these alliances can also mitigate rivalry by promoting cooperation, market specialization, and shared investment in infrastructure development.
- RNG Production Growth: Clean Energy Fuels reported a 17% increase in RNG production volumes in 2023 compared to 2022, highlighting the impact of strategic partnerships on scaling operations.
- Market Share Consolidation: Collaborations with companies like BP, which has a substantial existing fuel distribution network, can accelerate market penetration for RNG, potentially leading to market share consolidation.
- Investment in Infrastructure: Joint ventures often involve significant capital investment in new RNG production facilities and fueling infrastructure, which can create higher barriers to entry for new competitors.
Clean Energy Rivalry: Growth Meets High Barriers
Competitive rivalry in the clean energy sector is dynamic, influenced by market growth and strategic collaborations. While a growing market, like the projected 14.5% CAGR for RNG through 2030, can accommodate more players, intense competition arises from diverse fuel alternatives and high exit barriers. These barriers, exemplified by the billions invested in offshore wind farms, keep firms engaged even when struggling, thus sustaining rivalry.
| Metric | 2023 Value | Projected 2030 Value | CAGR (2023-2030) |
|---|---|---|---|
| Global RNG Market Value | ~$4.8 billion | ~$12 billion | ~14.5% |
| Offshore Wind Farm Investment (Typical Large Scale) | ~$3 billion+ | N/A | N/A |
SSubstitutes Threaten
Cost-Effectiveness of Substitutes
The primary substitutes for natural gas fuels in transportation are traditional diesel and gasoline. In 2024, the average price of gasoline in the U.S. hovered around $3.50 per gallon, while diesel prices were approximately $4.00 per gallon. These established fuels benefit from extensive existing infrastructure and a wide range of vehicle options, making them readily accessible and often more cost-effective upfront for many consumers and businesses.
Emerging alternatives like electricity and hydrogen also represent significant threats. The total cost of ownership for electric vehicles (EVs) is becoming increasingly competitive with internal combustion engine vehicles, with battery costs continuing to decline. By the end of 2024, the average cost of an EV was projected to be around $45,000, a decrease from previous years, while charging infrastructure continues to expand, though still lagging behind gasoline stations.
The cost-effectiveness of these substitutes, influenced by fluctuating fuel prices, vehicle acquisition costs, and the pace of infrastructure development, directly impacts the market share potential for natural gas fuels. For instance, a sustained drop in oil prices could make diesel and gasoline more attractive, while significant government incentives for EVs or hydrogen vehicles could accelerate their adoption, thereby diminishing the demand for natural gas in transportation.
Performance and Convenience of Substitutes
The performance and convenience of substitute energy sources significantly influence their threat to the clean energy sector. For instance, electric vehicles (EVs) are rapidly improving their range, with many 2024 models offering over 300 miles on a single charge, directly competing with gasoline vehicles. The expansion of charging infrastructure is also critical; by the end of 2023, the U.S. had over 170,000 public charging stations, a substantial increase that enhances EV convenience.
While natural gas vehicles (NGVs) present lower emissions, their refueling infrastructure, though growing, still lags behind traditional fuels, impacting their widespread adoption. Emerging technologies like hydrogen fuel cell vehicles are also gaining traction, with advancements in fueling station networks in select regions aiming to mirror the convenience of gasoline. These improvements in performance and convenience directly challenge the market share of established clean energy solutions.

Regulatory and Environmental Pressures
Increasing regulatory pressures to reduce greenhouse gas emissions are significantly impacting the clean energy sector. For instance, in 2024, many nations continued to strengthen emissions standards for vehicles, which directly favors substitutes like electric vehicles (EVs) and hydrogen fuel cell vehicles over traditional internal combustion engines that might utilize cleaner fuels.
Government incentives play a crucial role in accelerating the adoption of these alternatives. In 2024, the United States, through the Inflation Reduction Act, continued to offer substantial tax credits for EV purchases and charging infrastructure development, further bolstering the threat posed by EVs to natural gas vehicle markets.
These policy shifts and financial encouragements can rapidly alter the competitive landscape. As more consumers and businesses transition to cleaner alternatives, the demand for natural gas as a transportation fuel faces a growing substitution threat, driven by both environmental mandates and economic advantages offered by emerging technologies.
Technological Advancements in Substitutes
Technological progress in areas like electric vehicle battery density and hydrogen fuel cell performance is making these alternatives more viable and cost-effective. For instance, by 2024, advancements in solid-state batteries are expected to offer greater energy storage and faster charging times for electric trucks, directly challenging the market share of natural gas vehicles.
The expansion and improvement of charging and fueling networks are also critical. A robust infrastructure for electric and hydrogen vehicles reduces range anxiety and increases convenience, making them more attractive substitutes. The ongoing build-out of hydrogen refueling stations, supported by government initiatives, is a prime example of this trend.
The introduction of new, highly efficient heavy-duty electric or hydrogen trucks directly competes with natural gas-powered fleets. Companies are increasingly investing in these cleaner alternatives, driven by both environmental regulations and potential long-term operational cost savings. For example, by mid-2024, several major truck manufacturers are slated to release new models with significantly improved range and payload capacities, directly impacting demand for natural gas trucks.
- Battery Technology: Expected improvements in electric vehicle battery energy density by 2024 could increase truck range by up to 20%.
- Hydrogen Fuel Cells: Efficiency gains in hydrogen fuel cell technology are projected to reduce operating costs for hydrogen trucks, making them more competitive.
- Infrastructure Development: Significant government and private investment is expanding electric charging and hydrogen fueling infrastructure, reducing adoption barriers.
- New Vehicle Models: The launch of advanced electric and hydrogen heavy-duty trucks in 2024 offers direct competition to natural gas vehicle markets.
Customer Perception and Adoption Trends
Customer perception significantly influences the threat of substitutes in the clean energy sector. For instance, a growing public trust in the reliability and performance of electric vehicles (EVs) directly impacts the demand for alternatives like natural gas vehicles. By mid-2024, consumer surveys indicated a marked increase in willingness to consider EVs, driven by improved battery technology and charging infrastructure expansion.
The environmental benefits perception is a powerful driver. As awareness of climate change intensifies, customers are increasingly prioritizing zero-emission solutions. This trend could accelerate the decline of even relatively cleaner fossil fuels if perceived as less environmentally sound than renewable-powered options. For example, corporate sustainability goals are increasingly mandating the adoption of zero-emission fleets.
The long-term viability of fuel options also shapes customer choices. Concerns about the future availability and cost of natural gas, versus the perceived permanence of renewable energy sources, can sway purchasing decisions. By 2024, significant investments were being channeled into hydrogen fuel cell technology, signaling a long-term commitment that could present a formidable substitute.
Key trends impacting the threat of substitutes include:
- Growing consumer preference for zero-emission vehicles: Surveys in 2024 showed a significant uptick in consumer interest in EVs.
- Corporate sustainability mandates: Many businesses are setting targets for fleet electrification or hydrogen adoption.
- Advancements in battery and fuel cell technology: These innovations are enhancing the performance and reducing the cost of alternative energy vehicles.
- Government incentives and regulations: Policies supporting clean energy adoption directly influence customer perception and the viability of substitutes.
Natural Gas Faces Clean Energy Challengers
The threat of substitutes for natural gas in the clean energy sector is substantial, primarily driven by advancements in electric vehicles (EVs) and hydrogen fuel cell technology. By mid-2024, EV range improvements and expanding charging infrastructure are making them increasingly competitive, while hydrogen vehicles are benefiting from focused investment and infrastructure development. These alternatives offer zero-emission solutions that align with growing environmental consciousness and regulatory pressures, directly challenging natural gas's market position.
| Substitute Technology | Key 2024 Developments | Impact on Natural Gas |
|---|---|---|
| Electric Vehicles (EVs) | Average EV cost projected around $45,000; over 300 miles range for many models; U.S. had over 170,000 public charging stations by end of 2023. | Direct competition for vehicle sales and fuel demand, especially with government incentives like EV tax credits. |
| Hydrogen Fuel Cells | Efficiency gains reducing operating costs; government initiatives expanding fueling networks in select regions. | Emerging as a strong contender for heavy-duty transport, offering a zero-emission alternative with potentially faster refueling. |
| Traditional Fuels (Gasoline/Diesel) | Average U.S. gasoline price around $3.50/gallon; diesel around $4.00/gallon in 2024. | Remain a threat due to established infrastructure and lower upfront costs, especially if oil prices fall significantly. |
Entrants Threaten
Capital Requirements for Entry
Establishing a significant presence in the clean energy fueling station market, especially for Renewable Natural Gas (RNG), demands considerable capital. Building the necessary infrastructure, from fueling stations to RNG production facilities, represents a major financial hurdle. For instance, the average cost to construct a new compressed natural gas (CNG) fueling station can range from $1 million to $5 million, with RNG facilities often requiring even more significant upfront investment.
Access to RNG Supply and Distribution Networks
New companies entering the renewable natural gas (RNG) market would struggle to secure consistent and affordable feedstock, such as agricultural waste or landfill gas. Building out a comprehensive distribution network across North America, essential for delivering RNG to end-users, also presents a significant hurdle.
For instance, Clean Energy Fuels Corp. has already solidified its position by establishing long-term supply agreements and boasts an extensive network of over 600 fueling stations. This existing infrastructure and supply chain create a substantial barrier for any new entrant aiming to compete effectively in the RNG sector.

Regulatory Hurdles and Permitting
The clean energy sector faces significant regulatory hurdles that act as a barrier to new entrants. Navigating complex and evolving frameworks, including environmental standards and permitting for infrastructure like fueling stations, demands substantial time and financial investment. For instance, in 2024, the average time to obtain permits for new renewable energy projects in many developed nations continued to be a protracted process, often exceeding 18-24 months, thereby increasing upfront costs and delaying market entry.
Brand Recognition and Customer Relationships
Clean Energy Fuels Corp. benefits from a robust brand reputation and deeply entrenched customer relationships within the transportation industry. New competitors entering this space face a considerable hurdle, needing substantial investment in marketing and sales efforts to even begin building comparable brand awareness and securing vital customer contracts.
For instance, in 2023, Clean Energy Fuels reported revenues of $693 million, demonstrating the scale of its established operations and customer base. A new entrant would need to overcome this existing market presence.
- High initial marketing and sales expenditure required for new entrants to build brand recognition.
- Established customer loyalty and long-term contracts create significant barriers for competitors.
- Clean Energy Fuels' existing infrastructure and service network further solidify its market position.
- The capital required to match Clean Energy Fuels' brand equity and customer reach is substantial.
Economies of Scale and Experience Curve
Existing players in the clean energy sector, such as Clean Energy Fuels Corp., have established significant economies of scale. This allows them to achieve lower per-unit costs in areas like fuel procurement, processing, and distribution networks. For instance, in 2024, Clean Energy Fuels continued to leverage its extensive station network, which inherently reduces the marginal cost of serving additional customers.
New entrants would face the challenge of building comparable infrastructure and operational efficiencies from scratch. This means they would likely incur higher initial costs and a steeper learning curve to optimize their production and delivery processes. Without the benefit of an established experience curve, their early operational costs could be substantially higher than those of incumbents.
- Economies of Scale: Established companies benefit from bulk purchasing and optimized logistics, leading to reduced per-unit costs.
- Experience Curve: Incumbents have honed their operations over time, improving efficiency and lowering costs through accumulated knowledge.
- Capital Intensity: Building new infrastructure for clean energy production and distribution requires substantial upfront investment, creating a barrier for new, smaller-scale players.
- Market Access: Existing players often have secured long-term contracts and established relationships with customers, making it harder for new entrants to gain market share.
Significant Barriers to Entry in Clean Energy Fueling
The threat of new entrants in the clean energy fueling station market, particularly for Renewable Natural Gas (RNG), is significantly mitigated by substantial capital requirements and the need for extensive infrastructure development. Building out fueling stations and RNG production facilities can cost millions, with RNG operations often demanding even greater upfront investment. For example, constructing a new compressed natural gas fueling station typically ranges from $1 million to $5 million in 2024.
Securing consistent and affordable feedstock, such as agricultural waste or landfill gas, presents a major challenge for newcomers. Furthermore, establishing a comprehensive distribution network across North America, crucial for delivering RNG to end-users, is a formidable barrier. Clean Energy Fuels Corp. has already secured its market dominance through long-term supply agreements and an expansive network of over 600 fueling stations, making it difficult for new competitors to establish a comparable presence.
Regulatory complexities and the time-consuming permitting processes for new infrastructure also deter potential entrants. In 2024, obtaining permits for renewable energy projects often took 18-24 months, increasing upfront costs and delaying market entry. Additionally, the significant marketing and sales investment needed to build brand recognition and secure customer contracts, coupled with established customer loyalty and long-term agreements, create substantial hurdles for new companies seeking to compete.
| Barrier Type | Description | Example Data (2024/2023) |
| Capital Requirements | High upfront investment for infrastructure. | CNG fueling station construction: $1M - $5M. |
| Infrastructure & Distribution | Building extensive fueling networks and supply chains. | Clean Energy Fuels operates over 600 fueling stations. |
| Feedstock Access | Securing consistent and affordable raw materials. | Reliance on agricultural waste and landfill gas. |
| Regulatory Hurdles | Navigating complex environmental standards and permitting. | Permitting for renewable projects: 18-24 months average. |
| Brand & Customer Loyalty | Establishing brand recognition and securing customer contracts. | Clean Energy Fuels' 2023 revenue: $693 million. |
| Economies of Scale | Lower per-unit costs due to operational size. | Reduced marginal costs from extensive station network. |
Porter's Five Forces Analysis Data Sources
Our Clean Energy Porter's Five Forces analysis is built on a foundation of robust data, including government energy statistics, industry association reports, and financial disclosures from leading companies. We also incorporate market research from specialized clean energy analysts and regulatory filings to capture the full competitive landscape.
