AllianceBernstein Boston Consulting Group Matrix
Fully Editable
Tailor To Your Needs In Excel Or Sheets
Professional Design
Trusted, Industry-Standard Templates
Pre-Built
For Quick And Efficient Use
No Expertise Is Needed
Easy To Follow
GET THE FULL COMPANY
ANALYSIS BUNDLE FOR
AllianceBernstein
Visual. Strategic. Downloadable.
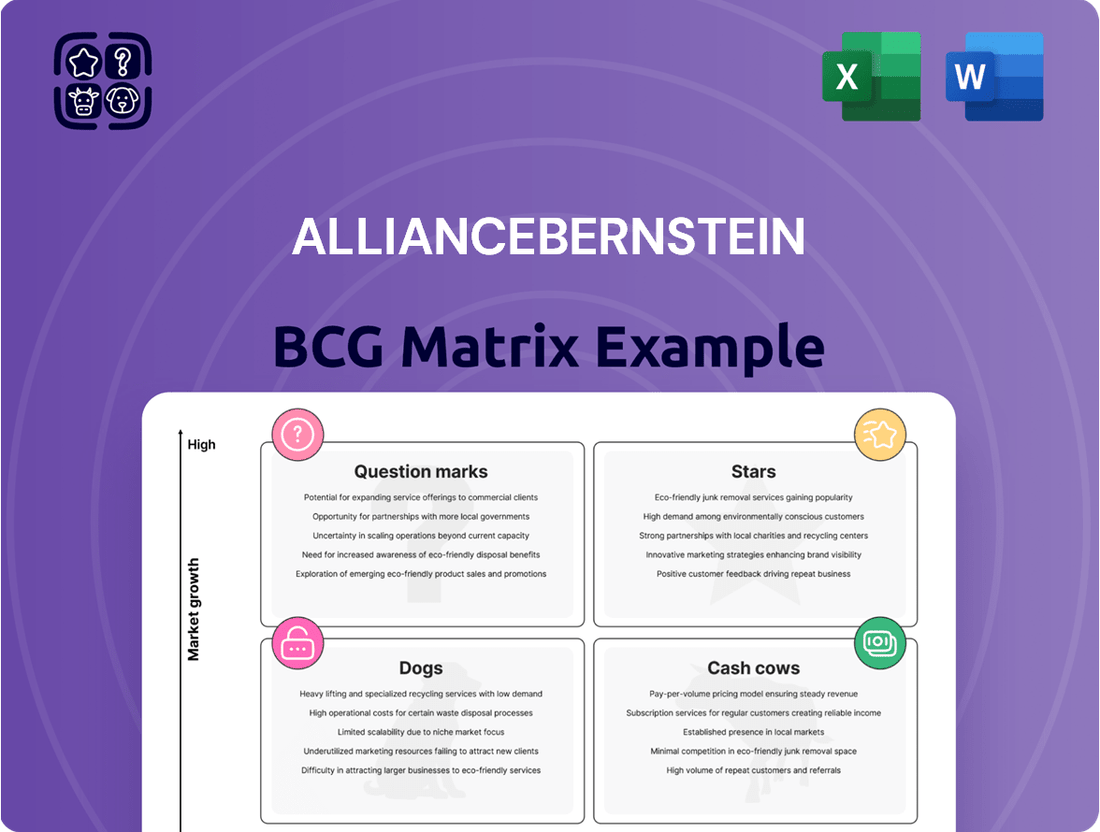
AllianceBernstein's BCG Matrix reveals its portfolio's potential. Products are categorized as Stars, Cash Cows, Dogs, or Question Marks. This snapshot provides a glimpse into their strategic allocation. Understanding this is crucial for smart investment decisions. Want the full picture?
The complete BCG Matrix offers in-depth quadrant analysis, actionable strategies, and a clear roadmap for growth. Get the full report for detailed insights and data-driven recommendations to elevate your strategic thinking and investment choices.
Stars
Private Markets and Alternatives
AllianceBernstein is prioritizing growth in private markets and alternative investments. They aim for $90-$100 billion in AUM by 2027. This segment saw a 14% rise, with $70 billion in AUM in 2024. These strategies are boosting performance fees.
Institutional Channel Inflows
AllianceBernstein's institutional channel saw strong growth, fueled by net inflows. A significant portion of this growth comes from private alternatives. Awarded but unfunded institutional mandates point to continued expansion. In 2024, institutional assets under management reached $365 billion, up from $340 billion in 2023.

Active Fixed Income
AllianceBernstein's active fixed income is doing well, drawing in lots of money. In 2024, this area saw a record-breaking organic growth rate. The platform's success highlights its appeal to investors. This growth demonstrates strong performance and market confidence.
Tax-Exempt Fixed Income
Tax-exempt fixed income has seen robust retail demand, demonstrating steady organic growth, a sign of a successful niche in the fixed income market. This area is attractive to investors seeking tax advantages. In 2024, municipal bond yields have fluctuated, reflecting market dynamics. This product offers diversification benefits.
- Retail demand for tax-exempt bonds remained strong in 2024.
- Municipal bond yields have varied in 2024.
- Tax-exempt fixed income provides diversification.
- This sector has seen organic growth.
Strategic Partnerships
Strategic partnerships are crucial for AllianceBernstein, boosting its service offerings. For instance, the collaboration with Equitable significantly improves insurance asset management. This partnership also fuels expansion in private markets, which is a key area of growth. In 2024, AllianceBernstein's assets under management (AUM) in private markets grew by 15%.
- Partnerships like the one with Equitable are key.
- These alliances boost insurance asset management.
- They support the growth of private markets.
- Private markets AUM saw a 15% increase in 2024.
Growth Highlights: Private Markets & Fixed Income Lead
AllianceBernstein's private markets and alternative investments are key Stars, demonstrating high growth and a strong market position. This segment grew to $70 billion in AUM in 2024, a 14% increase, and targets $90-$100 billion by 2027. Active fixed income also shines, achieving record organic growth in 2024, reflecting its robust market appeal and strong performance.
| Area | 2024 AUM | 2024 Growth |
|---|---|---|
| Private Markets & Alternatives | $70 Billion | +14% |
| Institutional AUM | $365 Billion | +7.35% (from $340B in 2023) |
| Private Markets AUM (Partnership) | - | +15% |
What is included in the product
AllianceBernstein's BCG Matrix assessment of its business units.
One-page overview placing each business unit in a quadrant
Cash Cows
Overall Assets Under Management (AUM)
AllianceBernstein's robust assets under management (AUM) are a key strength. In June 2025, AUM hit $829 billion. This impressive AUM generates consistent base management fees. These fees create a reliable revenue source for the firm.
Diversified Asset Mix
AllianceBernstein's diversified asset mix, spanning equities, fixed income, and alternatives, offers stability. This approach, as of late 2024, has helped manage risk in volatile markets. The diversification strategy supports consistent cash flow generation. Specifically, in 2024, their multi-asset strategies saw inflows, reflecting investor confidence. This strategy is designed to weather different economic cycles.

Established Brand and Reputation
AllianceBernstein (AB) benefits from a strong brand and reputation. This helps retain clients and maintain market share. In 2024, AB's assets under management (AUM) were approximately $750 billion. Stable AUM supports consistent revenue, crucial for cash flow.
Base Management Fees
Base management fees are a cornerstone of AllianceBernstein's (AB) revenue model, stemming from their substantial assets under management (AUM). These fees supply a steady and dependable cash flow stream for the firm. In 2024, AB's total revenue was approximately $3.1 billion, with a considerable portion attributable to these fees. The consistent nature of these fees helps stabilize AB's financial performance.
- Base management fees are a key revenue driver for AB.
- These fees are generated from AB's large AUM.
- They provide a predictable cash flow.
- In 2024, AB's revenue was around $3.1 billion.
Shareholder Distributions
AllianceBernstein (AB) is known for its consistent shareholder distributions, a key characteristic of a Cash Cow in the BCG Matrix. This reflects AB's ability to generate robust cash flow and reward its unitholders. In 2024, AB's dividend yield remained competitive within the asset management sector. This commitment to dividends underscores its financial stability and mature market position.
- Dividend payments are a major source of return for AB unitholders.
- AB's dividend yield is a key metric for investors.
- AB's financial stability supports its distributions.
AB's Steady Payouts: A Cash Cow's Dividend Power
AllianceBernstein (AB) exemplifies a Cash Cow with its consistent shareholder distributions. The firm's robust cash flow generation reliably rewards unitholders. In 2024, AB maintained a competitive dividend yield, signifying its financial stability and mature market position. This commitment to payouts underscores its predictable performance.
| Metric | 2024 Data | Attribute |
|---|---|---|
| Dividend Payout Ratio | ~70-80% | Consistent Returns |
| Dividend Yield | ~6.5% | Competitive Income |
| Cash Flow from Operations | >$1.2 Billion | Strong Generation |
Preview = Final Product
AllianceBernstein BCG Matrix
The AllianceBernstein BCG Matrix preview showcases the final, downloadable document. Post-purchase, you'll receive this same comprehensive report, ready for immediate strategic analysis. No alterations or hidden content—just the full, professional version. You can edit it, print it, and use it.

Dogs
Active Equity Outflows
AllianceBernstein has struggled with active equity outflows, especially in institutional channels. Data from 2024 showed continued outflows. This suggests difficulties in retaining market share. The outflows reflect a tough equity market environment.
Certain Institutional Mandates
Institutional inflows into private alternatives remain robust, but equity runoff risk and redemptions in other strategies highlight uneven performance. For example, in 2024, several hedge funds saw significant outflows, impacting their asset bases. This divergence suggests that institutional mandates vary in their ability to retain assets. Some strategies are clearly outperforming others, based on recent data.

Specific Regional Equity Strategies
Outflows from active equities have hit European and emerging market strategies hard. For example, in Q4 2024, European equity funds saw outflows of $15 billion. This suggests these regions might be underperforming or losing favor with investors. Client demand shifts are evident, with $10 billion pulled from emerging market funds in the same quarter. These trends signal potential challenges.
Underperforming or Niche Products with Low Market Share
In the context of AllianceBernstein (AB), "Dogs" represent underperforming products with low market share. These might include specific investment strategies or funds that haven't gained significant traction. For example, a niche bond fund might have a small market share compared to AB's broader offerings. AB could consider divesting from these underperforming products to reallocate resources. In 2023, AB's assets under management (AUM) were approximately $728 billion, so smaller, underperforming products would represent a tiny fraction of this total.
- Low market share reflects limited investor interest or performance.
- Divestiture can free up resources for better-performing areas.
- Specific fund performance data would vary widely.
- AB's overall AUM is a key financial metric.
Areas Affected by Fee Compression
Fee compression continues to challenge the asset management industry, affecting the profitability of products with lower margins. These areas can be considered "Dogs" if they're not boosting the bottom line. In 2024, the average expense ratio for actively managed U.S. equity funds was around 0.70%, versus 0.10% for passive funds, showing margin pressure. Areas with limited growth and high costs face scrutiny.
- Low-Margin Products: Funds with thin profit margins are vulnerable.
- Limited Growth Potential: Products with slow growth rates are at risk.
- High Expense Ratios: Funds with high fees struggle to compete.
- Market Trends: Passive investing's rise increases fee pressure.
Underperforming Products: A Strategic Shift?
AllianceBernstein's Dogs represent underperforming products with low market share and profitability. These often include active equity funds facing significant outflows, such as European and emerging market strategies which saw $15 billion and $10 billion pulled in Q4 2024, respectively. Fee compression further impacts these areas; actively managed U.S. equity funds averaged a 0.70% expense ratio in 2024, highlighting margin pressure on less competitive products. AB may consider divesting these segments to reallocate resources.
| Metric | Characteristic | 2024 Data Point |
|---|---|---|
| Market Share | Low | Specific fund market share varies |
| Profitability | Low Margin | Active US Equity Expense Ratio: 0.70% |
| Growth Potential | Limited | Q4 2024 European Equity Outflows: $15B |
Question Marks
Newly Launched Funds and Strategies
AllianceBernstein has recently expanded its offerings. This includes funds like the AB European Growth Portfolio and AB Global Growth Portfolio. The AB Emerging Markets Opportunities ETF is also a new addition. These strategies are in their initial phases. Their full market impact is still developing, with data for 2024 showing early performance trends.
Expansion into New Geographic Markets (e.g., China focus)
AllianceBernstein's strategic move includes eyeing expansion in new geographic areas, with a notable focus on China. This initiative positions the firm within the BCG Matrix as a Question Mark. The company's assets under management (AUM) reached $739 billion in 2024. Success hinges on effective strategies to gain market share.

Direct Indexing Platform
AllianceBernstein's (AB) launch of the AB Tax Advantaged Balanced Direct Index platform is a strategic move to tap into the expanding direct indexing market. Currently, direct indexing accounts for roughly 1% of total US equity assets, presenting a significant growth opportunity. AB's success in gaining market share with this offering will determine its classification within the BCG Matrix, potentially becoming a Star if it achieves substantial growth. As of late 2024, direct indexing assets are estimated to be over $400 billion.
Certain Alternative Investment Sub-strategies
Some alternative investment sub-strategies at AllianceBernstein could be Question Marks in the BCG Matrix. These strategies might operate in high-growth markets but have a smaller market share compared to established players. This positioning means they require significant investment to increase market share. For example, a new private credit fund might be in this category. Their success hinges on effective execution and seizing market opportunities.
- High-growth market, low market share.
- Requires significant investment.
- Success depends on execution.
- Examples include new private credit funds.
Initiatives for Inorganic Growth in Private Wealth
Bernstein Private Wealth Management is pursuing inorganic growth via new leadership hires. This approach targets the ultra-high-net-worth market, aiming to boost its market share. Success isn't guaranteed; initial outcomes are uncertain. Such moves reflect strategic ambition.
- In 2024, the ultra-high-net-worth market saw increased competition, with firms like Bernstein seeking strategic growth.
- Market share gains often come with integration challenges, impacting initial performance metrics.
- Leadership appointments are crucial for shaping the firm's future trajectory.
- The outcome depends on effective integration and market adaptation.
New Ventures: High Growth, Low Share
AllianceBernstein’s Question Marks in the BCG Matrix include new offerings like the AB European Growth Portfolio and the AB Tax Advantaged Balanced Direct Index platform, which aim for high-growth markets but currently hold low market share. These initiatives, along with new private credit funds and strategic hires in Bernstein Private Wealth Management, require significant investment to gain traction. For instance, direct indexing assets were over $400 billion in late 2024, presenting a large opportunity. Success depends on effective execution to convert these ventures into Stars or Cash Cows.
| Question Mark Area | Market Growth Rate (2024 Est.) | AB Market Share (2024 Est.) |
|---|---|---|
| Direct Indexing Platform | High (15-20%) | Low (initial phase) |
| New Global/European Growth Funds | Moderate to High (5-10%) | Low (early performance) |
| New Private Credit Funds | High (10-15%) | Low (emerging) |
BCG Matrix Data Sources
The AllianceBernstein BCG Matrix leverages comprehensive financial statements, market analysis, and industry expert insights.
