STAG Industrial Boston Consulting Group Matrix
Fully Editable
Tailor To Your Needs In Excel Or Sheets
Professional Design
Trusted, Industry-Standard Templates
Pre-Built
For Quick And Efficient Use
No Expertise Is Needed
Easy To Follow
STAG Industrial Bundle
See the Bigger Picture
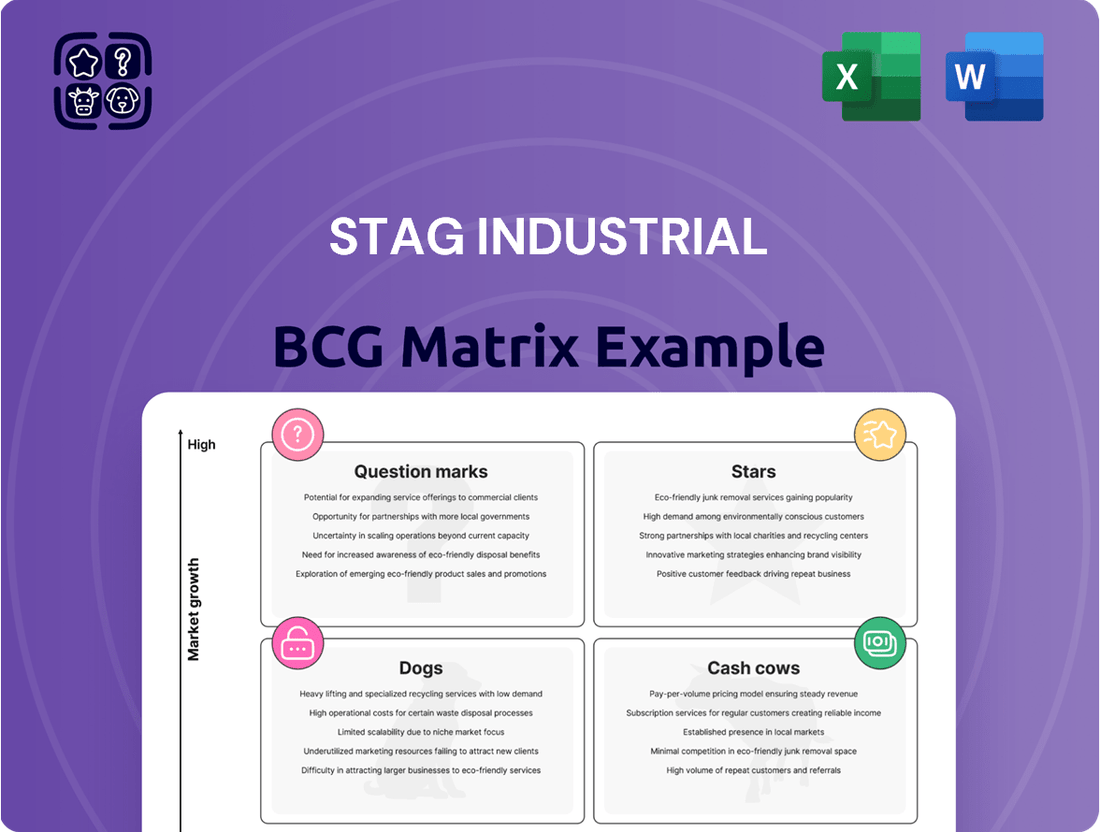
STAG Industrial's BCG Matrix reveals its market position across various property types. This snapshot offers a glimpse into its "Stars," "Cash Cows," and potential "Dogs." Understanding these dynamics is crucial for investment decisions. Learn how STAG allocates resources effectively. This preview is just the beginning. Get the full BCG Matrix report to uncover detailed quadrant placements, data-backed recommendations, and a roadmap to smart investment and product decisions.
Stars
Exposure to E-commerce Growth
STAG Industrial thrives on e-commerce expansion. E-commerce fuels demand for warehouses and distribution centers, benefiting STAG. The U.S. e-commerce penetration rate reached 15.5% in 2024, a key growth driver. This indicates a long runway for STAG's growth.
Strategic Acquisitions in Growth Markets
STAG Industrial focuses on strategic acquisitions in growing industrial markets. They target properties in Tier 1 and Tier 2 areas, which are experiencing high demand. This strategy helps STAG capitalize on favorable market conditions. In 2024, STAG's acquisitions totaled $800 million, increasing its portfolio.

Strong Rent Growth on New and Renewal Leases
STAG Industrial demonstrates robust rent growth, a key advantage in the BCG matrix. In Q1 2024, new leases saw a 17.9% increase in cash rents. Renewal leases also performed well, with a 9.5% increase. This highlights strong market demand and effective pricing strategies.
Development and Value-Add Projects
STAG Industrial's strategy includes development and value-add projects to boost returns in growing markets. This involves expansions and build-to-suit facilities. These projects offer higher returns compared to core acquisitions. For example, in 2024, value-add projects represented a significant portion of their investment activity.
- Development projects aim to increase property values.
- Value-add projects involve upgrades and improvements.
- Build-to-suit projects cater to specific tenant needs.
- These initiatives diversify STAG's revenue streams.
Diversified Portfolio
STAG Industrial's "Stars" status in the BCG Matrix highlights its robust, diversified portfolio. This strategy minimizes risk and amplifies growth opportunities. STAG's approach is evident in its broad tenant base and varied lease terms, enhancing its stability. This helps in navigating market fluctuations effectively.
- Geographic Diversity: STAG operates in 41 states.
- Tenant Industry Variety: The company serves various industries.
- Lease Term Management: STAG has a balanced lease duration strategy.
- Financial Performance: In 2024, STAG's revenue reached $790 million.
Industrial Real Estate: A Rising Star
STAG Industrial's "Star" position is reinforced by its strong market share in a rapidly expanding sector. Their strategic focus on e-commerce-driven industrial real estate ensures continued high growth. With Q1 2024 cash rents up 17.9% on new leases, STAG clearly commands a leading position. This blend of growth and market dominance solidifies its Star status.
| Metric | 2024 Data | Significance |
|---|---|---|
| E-commerce Penetration | 15.5% | Long-term demand driver |
| Q1 2024 New Lease Cash Rents | 17.9% Increase | Strong pricing power |
| 2024 Acquisitions | $800 Million | Market share expansion |
What is included in the product
Analysis of STAG Industrial's portfolio within BCG Matrix, offering strategic investment and divestment recommendations.
Clear STAG Industrial BCG Matrix provides a snapshot of portfolio performance.
Cash Cows
Stable Occupancy Rates
STAG Industrial's robust occupancy rates are a cornerstone of its "Cash Cow" status within the BCG matrix. In Q1 2024, STAG reported an impressive 97.2% occupancy rate, demonstrating its ability to retain tenants. This high occupancy directly translates to predictable and reliable rental income. The stability allows STAG to confidently manage its financial obligations and plan for future growth.
Predictable Cash Flow from Leases
STAG Industrial's long-term leases on industrial properties generate reliable cash flow, a key characteristic of a cash cow in the BCG Matrix. In 2024, STAG's occupancy rate remained high at around 97%, demonstrating the stability of its cash flow. This predictability allows for consistent dividend payments and reinvestment in the business. STAG's focus on single-tenant properties also contributes to this stability.

Monthly Dividend Payments
STAG Industrial, recognized as a "Cash Cow" in the BCG Matrix, is known for its monthly dividend payments, a key feature attracting income-focused investors. This consistent payout is supported by STAG's stable cash flow, derived from its portfolio of industrial properties. In 2024, STAG's dividend yield was approximately 4.5%, showcasing its commitment to returning value to shareholders. This consistent dividend strategy reinforces its position as a reliable investment.
Investment Grade Tenant Base
STAG Industrial benefits from a substantial investment-grade tenant base, ensuring dependable rental income and lower credit risk. This stability is crucial for long-term financial health. In 2024, a considerable percentage of STAG's leases were with investment-grade tenants. This reduces the likelihood of defaults.
- Investment-grade tenants enhance income reliability.
- Reduces credit risk, improving financial stability.
- Consistent cash flow supports dividends.
- Attracts investors seeking safe returns.
Efficient Property Management
STAG Industrial's efficient property management is key for its cash cow status. Effective management and high tenant retention ensure stable operations and predictable cash flows. This approach is evident in their robust financial performance. STAG's focus on operational excellence significantly boosts its position.
- In 2024, STAG reported a 97.1% occupancy rate, reflecting strong property management.
- The company's tenant retention rate was approximately 70% in 2024, demonstrating tenant satisfaction.
- STAG's net operating income (NOI) grew by 5.1% in 2024, driven by efficient management.
- These metrics highlight STAG's ability to generate consistent cash flows.
Reliable Income: The Cash Cow's Steady Returns
STAG Industrial functions as a robust Cash Cow, leveraging its stable industrial property portfolio. High occupancy rates, around 97% in 2024, ensure consistent rental income. This reliable cash flow supports predictable monthly dividends, attracting income-focused investors.
The company's significant investment-grade tenant base, along with efficient property management, further solidifies its dependable financial performance. These factors collectively underscore STAG's ability to generate steady returns with minimal growth investment.
| Metric | 2024 Data | Source |
|---|---|---|
| Occupancy Rate | ~97.1% | Q1 2024 Report |
| Dividend Yield | ~4.5% | Financial Data |
| NOI Growth | 5.1% | 2024 Performance |
Preview = Final Product
STAG Industrial BCG Matrix
The preview showcases the STAG Industrial BCG Matrix document you'll receive after purchase. It's a complete, ready-to-use report with no hidden content or watermarks. The file is immediately accessible for strategic evaluation and implementation.

Dogs
Properties in Weakening Markets
STAG's BCG Matrix highlights properties in weakening markets if they underperform. These could be in areas with economic decline or oversupply. For 2024, look at occupancy rates below the 95% average. Consider properties with negative rent growth too. Evaluate locations with increasing vacancy rates, as these may signal problems.
Properties with High Vacancy and Low Demand
Properties with high vacancy and low demand are often considered "Dogs" in STAG Industrial's BCG Matrix. These properties drain resources without generating substantial returns. In 2024, certain industrial submarkets experienced increased vacancy rates due to oversupply. For example, the industrial vacancy rate in the Inland Empire, a key market, reached 5.1% by Q4 2024, signaling potential "Dog" properties. These assets require strategic decisions, such as repositioning or disposal, to improve overall portfolio performance.

Non-Core Asset Dispositions
STAG Industrial, in its portfolio management, regularly sells properties that don't align with its strategic goals or show restricted growth, effectively disposing of "Dog" assets. In 2024, STAG's disposition volume reached $400 million, reflecting its active portfolio optimization. This strategy helps reallocate capital to higher-potential investments. Such moves are crucial for improving overall portfolio performance and focusing on core competencies.
Underperforming Acquisitions
Underperforming acquisitions in low-growth markets can indeed become Dogs. If a property fails to gain market share or meet return expectations, it faces potential divestiture. STAG Industrial's 2024 data shows specific acquisitions under scrutiny. This situation demands strategic choices regarding further investment or disposal.
- Low occupancy rates may signal underperformance.
- Poor rental growth compared to market averages is a key factor.
- High capital expenditure needs can worsen the situation.
- Divestiture is considered if returns are consistently low.
Segments with Limited E-commerce or Logistics Exposure
Certain segments within STAG Industrial's portfolio, such as those with limited e-commerce or logistics exposure, may experience slower growth. This is because they don't fully capitalize on the robust expansion of online retail and supply chain demands. For example, in 2024, industrial real estate's average cap rate was around 6.5%, while sectors with less e-commerce focus might see lower returns. These properties could face challenges in attracting tenants or achieving rent increases compared to logistics-focused assets.
- Limited Growth Potential: Properties lacking strong e-commerce ties may lag in growth.
- Market Dynamics: Industrial real estate's cap rates and tenant demands are crucial.
- Rent Increases: Logistics-focused properties often secure higher rent increases.
- Competitive Edge: E-commerce and logistics are key drivers in the sector.
STAG's "Dogs": Spotting & Shedding Underperforming Assets
STAG Industrial's "Dogs" are properties marked by underperformance, such as high vacancy rates and limited growth potential. In 2024, certain industrial submarkets, like the Inland Empire, saw vacancy rates reach 5.1% by Q4, signaling potential "Dog" assets. STAG actively disposes of these properties, with disposition volumes hitting $400 million in 2024, to optimize its portfolio and reallocate capital.
| Metric | 2024 Data | Implication |
|---|---|---|
| Industrial Vacancy (e.g., Inland Empire Q4) | 5.1% | High signals Dog |
| STAG Disposition Volume | $400M | Active Dog disposal |
| Avg. Industrial Cap Rate | 6.5% | Lower for Dog assets |
Question Marks
New Development Projects
STAG Industrial's new development projects, currently in growing markets, are classified as Question Marks. These properties are in high-growth areas, but their market share and success are yet to be fully realized. In 2024, STAG's development pipeline included projects in regions with strong industrial real estate demand. The company strategically invests in these developments to potentially capture significant market share. These projects require careful monitoring and resource allocation to maximize their potential.
Acquisitions in Emerging or Untested Markets
STAG's acquisitions in emerging industrial markets are akin to "question marks" in a BCG matrix. Their potential for future growth is high, but so is the risk. In 2024, STAG expanded its portfolio, with a focus on properties in less established areas. The company's strategy involves assessing risk versus reward in these new markets. This approach aims to capitalize on growth opportunities while managing uncertainties.

Properties Requiring Significant Value-Add Investment
Properties acquired for significant renovation or repositioning represent a key aspect of STAG Industrial's value-add strategy. These properties carry the potential for substantial returns, contingent on the successful implementation of their value-add plans. For example, in 2024, STAG Industrial allocated a portion of its $1.3 billion in acquisitions towards properties with value-add potential. The success rate of these projects directly impacts the company's overall profitability.
Expansion Projects on Existing Properties
Expansion projects on existing properties are Question Marks in STAG Industrial's BCG Matrix, where success hinges on market demand. These projects involve adding square footage or new capabilities to existing properties, carrying inherent risks. The outcome is uncertain, highly dependent on leasing rates and occupancy post-expansion. Consider the specific market dynamics when evaluating such projects.
- 2024 saw a 5.7% increase in industrial real estate values, but expansion returns vary.
- Leasing rates and occupancy are key performance indicators (KPIs) for success.
- Market-specific demand is crucial; oversupply can lead to losses.
- Capital expenditures (CAPEX) and ROI need careful assessment.
Investments in New Industrial Niches
STAG Industrial might consider venturing into new industrial niches for growth, even if unfamiliar. This could involve exploring property types beyond their usual focus. However, this expansion carries risks, as outlined in a 2024 report by CBRE, with a 6.2% vacancy rate for industrial properties nationally. STAG should weigh potential high returns against the challenges of new markets.
- Market Diversification: Expanding into specialized industrial properties can reduce reliance on the traditional single-tenant warehouse market.
- Higher Yields: New niches might offer superior returns compared to established property types.
- Increased Risk: Entering new markets involves understanding different tenant needs and higher initial investment costs.
- Competitive Landscape: Evaluate existing players and barriers to entry in potential new niches.
Industrial Real Estate: Navigating Growth and Risk
STAG Industrial's Question Marks encompass new developments and acquisitions in high-growth markets, plus value-add and expansion projects. These ventures, like the $1.3 billion allocated to acquisitions in 2024, aim for significant market share but carry inherent risks. Success hinges on market demand and effective resource allocation, as industrial real estate values increased 5.7% in 2024. New niches also represent Question Marks, facing a 6.2% national industrial vacancy rate in 2024.
| Question Mark Type | 2024 Context | Growth Potential |
|---|---|---|
| New Developments | Pipeline in high-demand regions | High, but market share uncertain |
| Emerging Market Acquisitions | Focus on less established areas | High, with elevated risk |
| Value-Add Projects | Portion of $1.3B acquisitions | Substantial, dependent on execution |
| Existing Property Expansions | Success tied to leasing rates | Variable, influenced by local demand |
| New Industrial Niches | Exploring beyond traditional focus | High, but increased market risk |
BCG Matrix Data Sources
STAG's BCG Matrix leverages company financials, industry reports, and market analyses, ensuring dependable, data-backed positioning.
