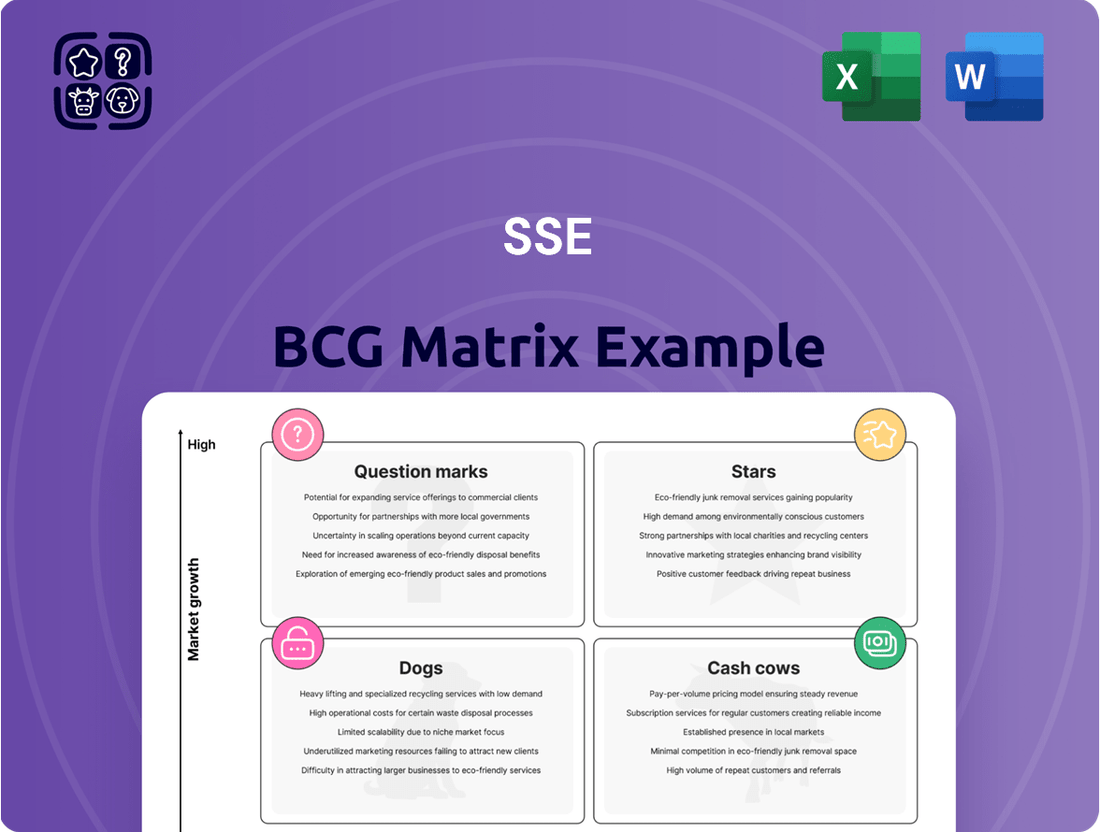
SSE Boston Consulting Group Matrix
Fully Editable
Tailor To Your Needs In Excel Or Sheets
Professional Design
Trusted, Industry-Standard Templates
Pre-Built
For Quick And Efficient Use
No Expertise Is Needed
Easy To Follow
GET THE FULL COMPANY
ANALYSIS BUNDLE FOR
SSE
See the Bigger Picture
Uncover this company's product portfolio with the BCG Matrix, quickly identifying Stars, Cash Cows, Dogs, and Question Marks. This glimpse reveals critical market positions and growth potential. Gain strategic advantage with our quadrant analysis. Discover investment opportunities and resource allocation strategies. Make informed decisions with our detailed report. Unlock actionable insights for enhanced profitability by purchasing the full BCG Matrix now!
Stars
Offshore Wind Projects (Under Construction/Development)
SSE is deeply involved in offshore wind, with major projects like Dogger Bank, the world's largest, under construction. The renewable energy market is experiencing high growth, creating opportunities for significant market share. SSE's investment in these projects, with Dogger Bank's Phase A costing £3 billion, positions them as future leaders. These ventures align with increasing global demand for sustainable energy solutions.
Onshore Wind Projects (Under Construction/Development)
SSE is actively expanding its onshore wind portfolio. These projects boost SSE's renewable energy generation, crucial in a growing market. The company is investing significantly; for example, in 2024, SSE Renewables invested £1.8 billion. Successful execution reinforces SSE's renewables leadership.

Electricity Transmission Network Upgrades (e.g., Shetland HVDC link, EGL2)
SSE is making significant investments in electricity transmission projects, like the Shetland HVDC link and Eastern Green Link 2 (EGL2). These initiatives are crucial for integrating renewable energy sources into the grid. The market for enhanced grid capacity is expanding due to the growing adoption of renewables. Completing these projects solidifies SSE's key position in energy infrastructure. In 2024, SSE invested £2.3 billion in its networks, including transmission.
Solar and Battery Storage Development
SSE is strategically investing in solar and battery storage, recognizing their rapid growth potential within the renewable energy sector. Although these segments may currently have a smaller market share compared to wind power, they are key areas for future expansion. This move aligns with the broader trend of increasing investment in renewable energy sources to combat climate change and meet evolving energy demands. In 2024, the global solar market grew significantly, with battery storage capacity also expanding considerably. These investments position SSE to capitalize on the burgeoning demand for clean energy solutions.
- Solar energy installations increased by 30% globally in 2024.
- The battery storage market saw a 40% growth in capacity during the same year.
- SSE aims to increase its renewable energy capacity by 50% by 2030.
- Investments in solar and battery storage are projected to yield a 20% return on investment.
International Renewable Energy Expansion
SSE Renewables is aggressively expanding internationally, focusing on markets like Continental Europe and Japan. This strategic move leverages growing global demand for renewable energy. International projects are crucial for SSE's future growth and market share expansion. In 2024, the global renewable energy market is projected to reach $881.7 billion. Successful ventures will enhance SSE's position.
- Focus on Continental Europe and Japan.
- Expands into growing global markets.
- Aims for future growth and market share.
- Global renewable energy market is projected to reach $881.7 billion in 2024.
Renewable Energy Giant: High Growth & Massive Investments
SSE's offshore and onshore wind projects, coupled with substantial electricity transmission investments, exemplify its BCG Matrix Stars. These segments operate in high-growth markets where SSE holds or is rapidly gaining significant market share. The company's international expansion further solidifies its Star position in the burgeoning global renewable energy market, projected at $881.7 billion in 2024.
| Area | 2024 Investment (£) | Market Growth (2024) |
|---|---|---|
| Onshore Wind | 1.8 billion | High |
| Networks (Transmission) | 2.3 billion | Expanding |
| Global Renewables Market | N/A (Market Size) | $881.7 billion |
What is included in the product
Identifies units to invest in, hold, or divest based on market share & growth.
Printable summary optimized for A4 and mobile PDFs
Cash Cows
Operational Electricity Transmission Network (North of Scotland)
SSE's electricity transmission network in northern Scotland is a cash cow due to its regulated status. This mature market offers low growth but provides stable revenue. SSE benefits from a significant, regulated market share in this area. In 2024, SSE's regulated businesses contributed significantly to its overall financial performance, ensuring consistent cash flow.
Operational Electricity Distribution Networks (Scotland and South England)
SSE's electricity distribution networks in Scotland and South England are cash cows, like transmission assets. These networks operate in a mature market, ensuring steady, regulated income. For 2024, SSE's regulated asset base grew, supporting stable cash flow. The regulatory framework provides predictable returns.

Operational Onshore Wind Farms (Established Assets)
SSE's operational onshore wind farms are mature, cash-generating assets. These established farms offer consistent renewable energy output, contributing to a steady revenue stream. In 2024, these farms generated significant cash flow. They provide a stable foundation for SSE's financial performance, a key element in the BCG matrix.
Operational Hydroelectric Power Assets
SSE's operational hydroelectric power assets are indeed cash cows, providing a steady stream of revenue. These assets, representing mature, reliable renewable energy sources, operate within a stable market environment. They consistently contribute significantly to SSE's energy output and overall financial performance. For instance, in 2024, hydroelectric power generated a substantial portion of SSE's renewable energy, ensuring robust cash flow.
- Mature, reliable renewable energy assets.
- Operate in a stable market.
- Consistent contribution to SSE's output.
- Significant cash flow generation.
Contracted Flexible Thermal Generation Assets
SSE's contracted flexible thermal generation assets are considered cash cows within its BCG matrix. These assets, crucial for system support, are contracted until 2029. They generate operating profit, offering a degree of revenue stability. This is particularly important in the evolving energy market.
- Contracted assets provide stable revenue.
- They are essential for system support.
- Contracts extend until 2029.
- Generates operating profit.
Cash Cows: Stable Returns & Predictable Flows
SSE's cash cows, like regulated electricity networks and mature renewable assets, consistently deliver stable, predictable cash flows from established markets. These assets require minimal investment while yielding high returns. For 2024, SSE's regulated asset base, a core cash cow component, was projected to exceed £12 billion, underpinning robust financial performance.
| Asset Type | Key Characteristic | 2024 Contribution | ||
|---|---|---|---|---|
| Regulated Networks | Stable, predictable revenue | Significant portion of RABS (over £12bn) | High market share | Low growth, high stability |
| Operational Renewables | Consistent energy output | Substantial cash flow generation | Mature technology | Environmental benefits |
| Flexible Thermal Generation | Contracted revenue until 2029 | Operating profit contributor | System support critical | Market stability |
What You See Is What You Get
SSE BCG Matrix
The BCG Matrix document you see now is identical to the one you'll download after purchase. Get instant access to this fully editable, strategically-focused report, ready for your business analysis. No hidden content or alterations—just the complete, professional document.

Dogs
Divested Retail Energy Business
SSE divested its retail energy business to OVO Energy in 2020. This move aligns with a strategic shift, likely due to low growth and intense competition in the retail energy market. The divestment suggests the business was a "Dog" in SSE's portfolio. In 2020, the deal was valued at £500 million, reflecting its perceived limited future growth potential for SSE.
Sold Stake in Gas Distribution Company (SGN)
In 2021, SSE divested its stake in SGN, a gas distribution company. The gas market is mature, facing a decline due to the energy transition. This move aligns with SSE's strategic shift towards electricity infrastructure and renewables. SSE's focus is on growing its renewable energy capacity. In 2024, SSE's capital expenditure is projected to be £2.4 billion.

Sold Stake in Multifuel Energy Plants
SSE sold its stake in multifuel energy plants, which convert waste to energy. This move potentially shifted capital to more strategic areas. In 2024, SSE's focus shifted towards renewable energy. This strategic realignment aimed to boost growth. The sale likely improved SSE's financial flexibility.
Legacy Non-Core Assets
SSE's "Dogs" in the BCG matrix would include legacy, non-core assets. These are typically in low-growth, niche markets, representing a drag on overall performance. Divestment of these assets is a strategic move to streamline operations and refocus capital. For example, in 2024, companies across various sectors divested over $1 trillion in assets globally.
- Non-core assets are those that don't align with the company’s core strategy.
- These assets often have low growth potential.
- Divestment frees up capital for more strategic investments.
- Focus on core competencies improves overall financial performance.
Underperforming or Obsolete Infrastructure (if any)
In the SSE BCG Matrix, "Dogs" represent underperforming assets. Legacy infrastructure like older power plants or pipelines in shrinking markets fits this category. These assets drain resources without significant returns, typically signaling their decommissioning or sale. For example, in 2024, several utilities announced plans to retire coal-fired plants due to inefficiency and environmental concerns.
- Outdated power plants face high maintenance costs.
- Pipelines in low-demand areas struggle to generate profit.
- Decommissioning is often a strategic response.
- Sales are considered to recover some investment.
SSE's Strategic Shift: Shedding "Dogs" for Growth
SSE's "Dogs" are non-core, low-growth assets, such as divested retail energy or older infrastructure. These assets typically hold limited market share in mature or declining sectors. Divesting them allows SSE to reallocate capital, with 2024 capital expenditure projected at £2.4 billion for renewables. This strategic streamlining focuses resources on high-growth segments.
| Asset Type | Market Growth | SSE Action | ||
|---|---|---|---|---|
| Retail Energy | Low | Divested (2020) | £500M | Streamlined |
| Gas Distribution | Declining | Divested (2021) | N/A | Refocused |
| Multifuel Plants | Niche | Sold | N/A | Capital Shift |
Question Marks
Early-Stage International Renewable Development Pipeline
SSE's early-stage renewable projects pipeline focuses on international markets, representing a "Question Mark" in the BCG Matrix. These markets offer high growth potential but currently hold low market share for SSE. Developing these projects into operational assets requires substantial financial investment. In 2024, SSE invested £2.5 billion in renewables.
Development of New Technologies (e.g., Hydrogen, Carbon Capture)
SSE is actively engaged in the development of new technologies, with a focus on promising areas such as hydrogen and carbon capture. These technologies are in their early stages, representing high-growth potential markets, although their current market share and commercial viability are still limited. For example, in 2024, investments in hydrogen-related projects totaled approximately $10 billion globally. These initiatives require substantial research and development investments to fully assess their long-term potential and commercial feasibility, and this is a key focus area for SSE.

Large-Scale Battery Storage Projects (Early Stages)
SSE's battery storage projects are in early phases compared to its wind power assets. The utility-scale battery market is rapidly expanding, yet no single company has a stronghold. Success hinges on effective project execution to boost contributions. In 2024, the global battery storage market is valued at $10.5 billion, with a projected compound annual growth rate (CAGR) of 20% through 2030.
Exploration of Floating Offshore Wind Technology
SSE is venturing into floating offshore wind, a "Question Mark" in its BCG Matrix. This technology is newer than fixed-bottom wind, signifying higher risk. However, the potential rewards are substantial if successful. This move could unlock significant market opportunities for SSE. In 2024, the global floating wind capacity is projected to reach 1.5 GW.
- High growth potential, but unproven technology.
- Higher risk, due to the technology's immaturity.
- Significant market opportunity if successful.
- SSE is actively exploring and investing in this area.
Potential Future Market Entries or Partnerships
If SSE considers entering new energy market segments or forming partnerships, it would begin as a question mark within the BCG Matrix. These ventures would involve high-growth areas where SSE has no existing market share, presenting significant uncertainty. Success demands thorough evaluation and strategic investments, as the company navigates unchartered territory. SSE must assess market viability, competitive landscapes, and potential returns before committing capital.
- Market Entry: SSE might explore renewable energy storage, a market projected to reach $292.9 billion by 2030.
- Partnerships: Collaborations with tech firms could boost smart grid initiatives, which are growing.
- Strategic Investment: SSE's 2024 capital expenditure was roughly £2.2 billion, a portion of which could be allocated to these new ventures.
- Evaluation: A detailed SWOT analysis is essential to assess the risks and opportunities in each potential market.
High-Growth Ventures: SSE's Strategic Bets
SSE's Question Marks represent high-growth potential areas with low current market share, demanding substantial investment and carrying higher risk. These include early-stage international renewables and emerging technologies like hydrogen. For instance, in 2024, global hydrogen investments reached $10 billion, highlighting this sector's potential. Success in these ventures could unlock significant future market opportunities for SSE.
| Area | 2024 Data | Growth Outlook |
|---|---|---|
| Renewables Investment | £2.5 billion | High |
| Battery Storage Market | $10.5 billion | 20% CAGR to 2030 |
| Floating Wind Capacity | 1.5 GW | Significant Potential |
BCG Matrix Data Sources
This BCG Matrix is built with financial statements, industry analyses, and market data from reputable research to power our insights.
