SBI Cards and Payment Services Boston Consulting Group Matrix
Fully Editable
Tailor To Your Needs In Excel Or Sheets
Professional Design
Trusted, Industry-Standard Templates
Pre-Built
For Quick And Efficient Use
No Expertise Is Needed
Easy To Follow
SBI Cards and Payment Services Bundle
See the Bigger Picture
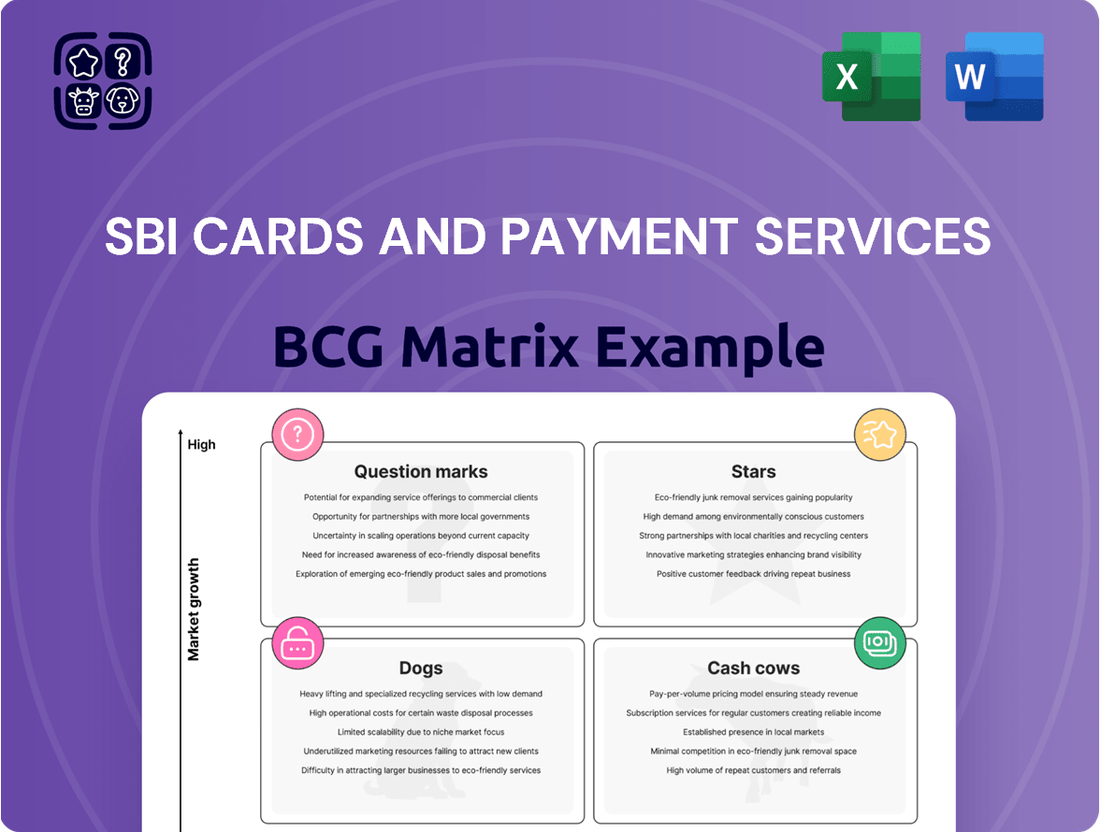
SBI Cards operates in a dynamic financial landscape. Its BCG Matrix helps assess each product's market position. Stars represent high-growth, high-share products like premium cards. Cash Cows generate strong revenue, like core credit card offerings. Dogs are products with low growth, low share. Question Marks are newer products with uncertain futures.
This preview only scratches the surface. Get the full BCG Matrix report to uncover detailed quadrant placements, data-backed recommendations, and a roadmap to smart investment and product decisions.
Stars
Market Position
SBI Cards shines as a "Star" in its BCG matrix, holding the second-largest credit card issuer position in India. In 2024, SBI Cards reported ₹17,408 crore in revenue. Its robust market share reflects its strong growth potential. The credit card market in India is expanding rapidly.
Growing Cards-in-Force
SBI Cards' "Growing Cards-in-Force" is a Star in the BCG Matrix. The company has consistently expanded its cards in circulation, exceeding 2 crore. This growth reflects successful customer acquisition and retention. In 2024, SBI Cards' market share increased, indicating strong performance in the competitive credit card market.

Digital Transformation Initiatives
SBI Cards is actively pursuing digital transformation. They are investing in digital platforms. This includes initiatives like SBI Card Sprint. The goal is to improve customer experience and streamline operations. Digital payments in India continue to see substantial growth. In fiscal year 2024, digital transactions reached ₹16,466 crore.
Strong Parentage and Brand Recognition
SBI Cards, benefiting from its strong parentage, enjoys substantial brand recognition in India, a critical factor for its "Star" status in the BCG Matrix. This backing from State Bank of India (SBI) fosters trust and credibility, driving customer acquisition and market share gains. In 2024, SBI Cards demonstrated its market strength, with over 18 million cards in circulation. This strong parentage supports its growth trajectory.
- SBI's brand recognition is a key driver of customer acquisition.
- SBI Cards holds a significant market share in the Indian credit card sector.
- The financial backing from SBI supports SBI Cards' operational capabilities.
- SBI Cards' revenue and profitability metrics are robust.
Focus on Premium and Co-branded Cards
SBI Cards is focusing on premium and co-branded cards to boost its market position. These cards target high-spending customers, aiming for increased revenue and profitability. This strategy aligns with overall growth plans in the competitive cards market. In 2024, SBI Cards reported a total of 17.4 million cards in force.
- Premium cards offer exclusive benefits, attracting affluent customers.
- Co-branded cards enhance customer loyalty through partnerships with specific brands.
- Focus on these cards is a key part of SBI Cards' strategic growth.
- This strategy aims to improve profitability and market share.
SBI Cards: Dominance in India's Credit Card Market
SBI Cards maintains its Star position as India's second-largest credit card issuer, showcasing significant market share and growth. In 2024, the company recorded a revenue of ₹17,408 crore, driven by its expanding customer base. With over 18 million cards in circulation, SBI Cards capitalizes on the rapidly growing Indian credit card market, solidifying its dominant standing.
| Metric | Unit | 2024 Data |
|---|---|---|
| Revenue | ₹ Crore | 17,408 |
| Cards in Force | Million | 18+ |
| Market Position | Rank | 2nd Largest |
What is included in the product
Tailored analysis for SBI Cards' portfolio across BCG Matrix quadrants.
Printable summary optimized for A4 and mobile PDFs, enabling easy distribution of the SBI Cards BCG Matrix.
Cash Cows
Interest Income from Receivables
Interest income from receivables is a primary revenue source for SBI Cards, contributing significantly to its financial stability. For the fiscal year 2024, interest income constituted a substantial portion of SBI Cards' total income, reflecting its reliance on this revenue stream. This consistent income stream solidifies its position as a Cash Cow within its BCG matrix, generating reliable cash flow. As of March 2024, SBI Cards reported a total income of ₹15,944 crore, with a considerable portion derived from interest on receivables.
Established Customer Base
SBI Cards boasts a massive customer base, crucial for its "Cash Cow" status. In 2024, SBI Cards issued over 16.5 million credit cards. This large base ensures steady income from transactions. The company's revenue in FY24 was approximately ₹15,900 crore.

Fee-Based Income
SBI Cards generates significant revenue from fees. In FY24, fee and commission income was ₹3,849 crore. This includes fees from transactions and EMI conversions. This diversified revenue stream helps stabilize earnings.
Consistent Dividend Payouts
SBI Cards and Payment Services' consistent dividend payouts highlight its strong financial health. This indicates the company's ability to generate steady cash flow. The company's commitment to dividends is a key factor for investors seeking income. In fiscal year 2024, SBI Cards declared an interim dividend.
- Dividend Yield: Approximately 1.15% in FY24.
- Payout Ratio: Around 20-25% of net profits, indicating a sustainable dividend policy.
- Dividend History: Regular payouts over the past 3 years.
- Financial Stability: Supported by a robust customer base and market position.
Diversified Revenue Model
SBI Cards and Payment Services showcases a diversified revenue model, vital for its cash cow status within the BCG Matrix. This diversification includes both interest income and earnings tied to customer spending. This strategy helps maintain stable income from its significant market presence.
- In FY24, SBI Cards' interest income and fees & commission income contributed significantly to its revenue.
- Spend-based earnings come from transaction fees, a key source of income.
- SBI Cards had a market share of approximately 18% in the Indian credit card market by the end of FY24.
SBI Cards: A Cash Cow in the Credit Card Market
SBI Cards acts as a Cash Cow due to its strong market position and consistent cash generation. Its significant interest income and fee collection, totaling ₹15,944 crore in FY24, provide stable cash flows. With over 16.5 million cards issued, it maintains a robust customer base. This enables reliable dividend payouts and supports other business ventures.
| Metric | FY2024 Value | Contribution |
|---|---|---|
| Total Income | ₹15,944 crore | Primary Revenue |
| Cards Issued | 16.5 million+ | Customer Base |
| Fee Income | ₹3,849 crore | Diversified Revenue |
| Market Share | ~18% | Market Leadership |
Full Transparency, Always
SBI Cards and Payment Services BCG Matrix
The displayed preview mirrors the complete SBI Cards and Payment Services BCG Matrix you'll receive. This is the final, downloadable version—no edits, no hidden content—ready for immediate strategic application.

Dogs
Increasing Gross and Net NPAs
Rising Gross and Net NPAs signal asset quality challenges for SBI Cards. In FY24, the Gross NPA ratio was 2.43%, while Net NPA stood at 0.89%. This suggests a portion of the credit card portfolio isn't performing as expected, necessitating higher provisioning. Increased NPAs can erode profitability and impact future growth. The company needs to carefully manage and recover these assets.
Moderation in Profitability
SBI Cards and Payment Services, a "Dog" in its BCG matrix, shows moderation in profitability despite revenue growth. The net profit dipped to ₹2,028 crore in FY24, a decrease from ₹2,077 crore the previous year. Return on assets also declined. Higher credit costs and margin pressures played a role.

Rising Credit Costs
SBI Cards' "Dogs" quadrant highlights rising credit costs. In FY24, impairment losses and provisions for bad debts increased. This suggests a portfolio segment underperforming. The net profit for FY24 decreased to ₹2,028 crore. Such issues consume resources.
Slowdown in Spending Growth on Certain Cards
SBI Cards might face "dogs" if certain card categories or customer segments show weak spending growth, becoming cash traps. For instance, sectors like travel or entertainment, which were slow to recover post-pandemic, could be problematic. Data from 2024 indicates a 10% increase in overall card spending, but some segments lag. Addressing this, SBI Cards needs targeted strategies.
- Focus on high-growth sectors.
- Segment-specific marketing.
- Incentivize card usage.
- Monitor spending patterns.
Impact of Increased Risk Weightage on Unsecured Loans
Increased risk weightage on unsecured loans, as mandated by regulatory changes, directly impacts SBI Cards and Payment Services. This leads to higher capital requirements, increasing the cost of borrowing and potentially squeezing profitability within their credit card segment. For instance, the Reserve Bank of India (RBI) increased risk weights on consumer credit, impacting unsecured loans. This regulatory adjustment could lead to changes in how SBI Cards manages its portfolio and assesses risk.
- Regulatory changes increase borrowing costs.
- Profitability pressure within credit card segment.
- SBI Cards must adapt portfolio and risk assessment.
- Higher capital requirements due to risk weightage.
SBI Cards: Navigating Low-Growth Challenges
SBI Cards' Dogs quadrant indicates low-growth, low-market-share segments, characterized by declining profitability and asset quality issues.
In FY24, net profit decreased to ₹2,028 crore, reflecting higher credit costs and a Gross NPA ratio of 2.43%.
Regulatory changes, including increased risk weightage on unsecured loans, further squeeze margins and elevate capital requirements for these underperforming areas.
| Metric | FY24 Data | Impact | ||
|---|---|---|---|---|
| Net Profit | ₹2,028 crore | Declined | ||
| Gross NPA | 2.43% | Increased | ||
| Credit Costs | Increased | Higher |
Question Marks
Expansion in Tier 2 and Tier 3 Cities
SBI Cards' expansion into Tier 2 and Tier 3 cities aligns with its strategy to tap into underpenetrated markets. This initiative, while promising high growth, demands substantial investment in customer acquisition and infrastructure. In 2024, the company's focus on these areas could reflect in increased marketing spends and branch expansions. This strategy aims to capture a larger share of the growing consumer base in these regions.
New Product Launches (e.g., Tata Neu SBI Card, SBI Card Miles)
New product launches like the Tata Neu SBI Card and SBI Card Miles represent Question Marks in SBI Cards' BCG matrix. These co-branded and travel-focused cards tap into growing markets, aiming for significant market share. SBI Cards reported 2.4 million cards issued in Q3 FY24, indicating room for growth. Successful adoption is crucial for these products to evolve into Stars.

UPI-Linked Credit Cards
UPI-linked credit cards represent a "Question Mark" for SBI Cards within the BCG matrix. This segment, leveraging the RuPay network, has significant growth potential in digital payments. However, its market share is currently unproven, requiring strategic investments and aggressive expansion. In 2024, the digital payments sector in India surged, with UPI transactions exceeding ₹18 trillion monthly, indicating a vast market to capture. SBI Cards aims to capitalize on this, but faces competition from established players.
Digital Onboarding Platform (SBI Card Sprint)
The SBI Card Sprint, a digital onboarding platform, is a "question mark" in SBI Cards and Payment Services' BCG matrix. It represents a strategic move aimed at boosting customer acquisition and streamlining operations. While digital onboarding offers growth potential, its success hinges on efficiently attracting new customers and minimizing expenses. The platform's performance will determine its future trajectory within the portfolio.
- In 2024, digital onboarding initiatives in the financial sector saw a 20% increase in adoption.
- SBI Cards aims to onboard 1 million customers through digital channels by the end of 2024.
- Digital onboarding typically reduces customer acquisition costs by 15-20%.
- The platform's effectiveness will be measured by its contribution to overall profitability and market share.
Embedded Credit and BNPL Options
Embedded credit and BNPL are expanding markets for SBI Cards. These options provide flexible payment solutions. SBI Cards should increase its market share in this area. In 2024, BNPL transactions reached $100 billion globally.
- Market growth for embedded credit and BNPL is significant.
- SBI Cards needs to capitalize on this trend.
- BNPL offers flexible payment solutions to customers.
- Increasing market share is critical for SBI Cards.
New Ventures: High Stakes in Digital Payments
SBI Cards' Question Marks include new products like Tata Neu and UPI-linked cards, targeting high-growth digital and co-branded segments. Expansion into Tier 2/3 cities and digital onboarding via SBI Card Sprint represent areas of significant investment and uncertain market share. In 2024, digital payment growth exceeding ₹18 trillion monthly underscores the vast potential, yet these initiatives demand substantial resource allocation for future success.
| Category | Growth Potential | 2024 Data |
|---|---|---|
| Tier 2/3 Expansion | High | Increased marketing spend |
| UPI-linked Cards | High | UPI >₹18T monthly transactions |
| SBI Card Sprint | High | Digital onboarding +20% adoption |
BCG Matrix Data Sources
The BCG Matrix for SBI Cards relies on financial filings, industry analysis, and market growth data.
