Hellenic Petroleum Boston Consulting Group Matrix
Fully Editable
Tailor To Your Needs In Excel Or Sheets
Professional Design
Trusted, Industry-Standard Templates
Pre-Built
For Quick And Efficient Use
No Expertise Is Needed
Easy To Follow
Hellenic Petroleum Bundle
See the Bigger Picture
Hellenic Petroleum operates within a complex energy landscape. Their BCG Matrix likely reveals a mix of products. Some may be "Stars," leading the market and requiring investment. Others might be "Cash Cows," generating profits.
But which products are "Dogs" or "Question Marks?" The full BCG Matrix gives you those answers. Discover detailed quadrant placements, data-driven recommendations, and a strategic roadmap.
Stars
Renewable Energy Portfolio Growth
HELLENiQ ENERGY is aggressively growing its renewable energy portfolio. The company aims for 1 GW of operational capacity by 2026 and 2 GW by 2030. Over four years, its RES portfolio grew by 400% annually. This expansion is fueled by acquisitions and projects in Greece and Romania. The company invested €300 million in renewables in 2024.
International Marketing Expansion
HELLENiQ ENERGY's international marketing is strong, boosted by its growing network and better margins in Southeast Europe. The company operates over 300 service stations across Cyprus, Serbia, Bulgaria, Montenegro, and North Macedonia. In 2024, exports made up over 60% of total sales, showing the company's global reach.

Petrochemicals Market Leadership
HELLENiQ ENERGY, the sole Greek petrochemicals producer, boasts over 50% domestic market share. This strong market position is bolstered by substantial export sales, enhancing its revenue streams. In 2024, the company's petrochemical segment generated significant revenue, reflecting its market dominance.
Refining Production and Exports
HELLENiQ ENERGY's refining segment showed robust results in 2024, achieving record production levels. The company manages three of Greece's four refineries, controlling roughly 65% of the nation's refining capabilities. A significant volume of their refined outputs is exported, affirming their crucial role in the region. This underscores their strategic importance in the energy market.
- Refining capacity: HELLENiQ ENERGY controls about 65% of Greece's refining capacity.
- Production: Achieved record high production in 2024.
- Exports: A substantial portion of refined products are exported.
Strategic Vision 2025 Implementation
HELLENiQ ENERGY is executing its Vision 2025, targeting operational excellence, core business growth, and RES expansion. This strategy aims to transform the company. In 2024, the company invested significantly in renewable energy projects. The goal is to adapt to the evolving energy landscape.
- Vision 2025 focuses on operational excellence.
- Growth in core activities is a key strategic goal.
- Development of a substantial RES pillar is underway.
- Investments in renewable energy are increasing.
HELLENiQ ENERGY: RES Portfolio Soars with 400% Growth!
HELLENiQ ENERGY's Renewable Energy Sources (RES) portfolio stands out as a Star, demonstrating exceptional growth. The company achieved a 400% annual growth rate for its RES portfolio over four years. In 2024, HELLENiQ ENERGY invested €300 million in renewables, targeting 1 GW of operational capacity by 2026. This rapid expansion in a high-growth market positions RES as a key future driver.
| Category | Metric | 2024 Data |
|---|---|---|
| Renewable Energy | Investment | €300 million |
| Renewable Energy | Annual Growth (4 yrs) | 400% |
| Renewable Energy | Target Capacity (2026) | 1 GW |
What is included in the product
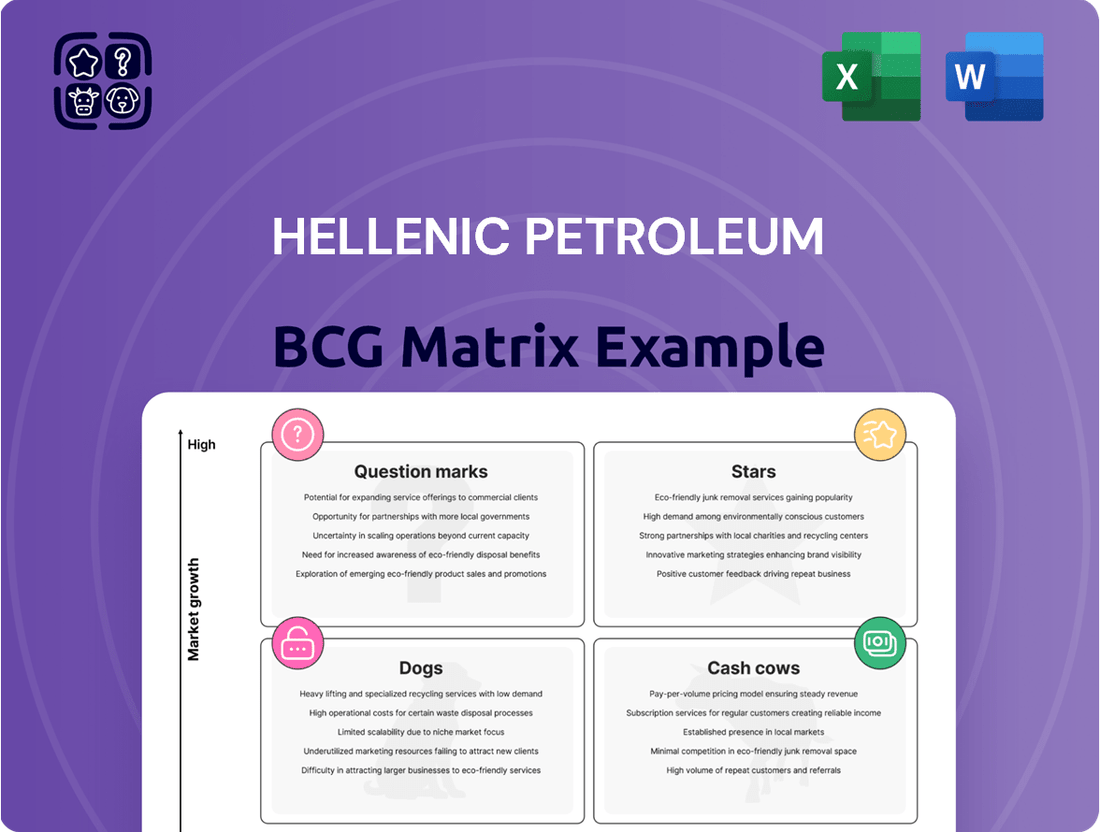
Hellenic Petroleum's BCG Matrix analysis covers Stars, Cash Cows, Question Marks, and Dogs units, identifying investment, holding, and divestment strategies.
Printable summary optimized for A4 and mobile PDFs that facilitates easy data distribution.
Cash Cows
Domestic Fuel Marketing Network
HELLENiQ ENERGY's domestic fuel marketing in Greece is a cash cow, with over 1,500 service stations. This mature market provides steady cash flow. In 2024, the company likely maintained its strong market share. Expect consistent revenue generation despite slower growth compared to other segments.
Refining Operations in Greece
Hellenic Petroleum's Greek refineries are cash cows. They have a combined capacity of 342-344 kbpd. This generates substantial revenue, despite refining margin shifts. In 2024, refining margins show stability, supporting consistent profitability.

Wholesale Oil Products Market Share
HELLENiQ ENERGY dominates the Greek wholesale oil products market with a 60% market share, as of 2024. This substantial market position translates into a reliable revenue source. The company's robust presence in wholesale oil contributes significantly to its financial stability. This segment is critical for the firm's overall profitability.
Existing Power Generation Assets
HELLENiQ ENERGY, via ELPEDISON, manages conventional power plants with a total capacity of 852 MW. These established assets generate steady cash flow for the company. In 2024, the power sector's stable performance provided reliable revenue streams. This segment is a cash cow within HELLENiQ ENERGY's portfolio.
- 852 MW total capacity from conventional power plants.
- Stable revenue generation in 2024.
- Focus on reliable cash flow.
Established Petrochemical Production
Hellenic Petroleum's established petrochemical production, holding over 50% of the Greek market, represents a solid cash cow. This segment generates reliable revenue, despite being a mature market compared to renewables. The company's vertical integration, especially in the propylene-polypropylene chain, boosts its strong position. In 2024, the petrochemicals segment contributed significantly to the group's overall profitability, demonstrating its continued importance.
- Market share in Greece exceeds 50%.
- Generates stable revenue.
- Vertical integration in the propylene-polypropylene chain.
- Contributed significantly to group profitability in 2024.
Fueling Success: Key Drivers of Revenue
HELLENiQ ENERGY’s cash cows primarily encompass its Greek refineries (342-344 kbpd capacity) and dominant domestic fuel marketing (over 1,500 stations). Additionally, its 60% share in Greek wholesale oil products and established petrochemicals (over 50% market share) consistently generate significant revenue. These mature segments, including 852 MW conventional power, ensured stable profitability and cash flow in 2024.
| Segment | Key Metric | 2024 Status/Data |
|---|---|---|
| Greek Refineries | Capacity | 342-344 kbpd |
| Domestic Fuel Marketing | Service Stations | Over 1,500 |
| Wholesale Oil Products | Market Share | 60% |
| Conventional Power | Total Capacity | 852 MW |
| Petrochemical Production | Greek Market Share | Over 50% |
Full Transparency, Always
Hellenic Petroleum BCG Matrix
The Hellenic Petroleum BCG Matrix preview is identical to the purchased document. You'll get a complete, professionally crafted analysis ready for strategic planning. The full, downloadable report provides immediate use.

Dogs
Legacy Assets in Declining Markets
Legacy assets at Hellenic Petroleum, such as older refineries or distribution networks, face challenges as demand for traditional fuels evolves. These assets, if not modernized, may become dogs in the BCG matrix. In 2024, Hellenic Petroleum's refining margins faced pressure amid fluctuating crude oil prices, which could impact the profitability of these older assets. Strategic divestment or upgrades are crucial for improving efficiency and financial performance.
Underperforming International Marketing Stations
Some international marketing stations of Hellenic Petroleum might struggle. In 2024, some stations might show low market share and profitability. These "dogs" need a review for improvement or potential sale. For example, if a station's revenue dropped by 15% compared to the 2023 average, it could be a concern.

Non-Core or Small-Scale Operations
Non-core or small-scale operations within Hellenic Petroleum, classified as "Dogs," demand resources yet offer limited returns. Identifying these assets requires detailed internal analysis, which is crucial for strategic decision-making. For instance, in 2024, certain low-performing retail segments might fit this category. Focusing on these areas, the company can reallocate resources. This can significantly improve overall financial efficiency.
Outdated Technologies in Refining
Outdated technologies in Hellenic Petroleum's refining processes present significant challenges. These older parts of the infrastructure often have lower efficiency. This could lead to higher environmental impact, becoming a financial burden. Without upgrades, these areas drain resources in a market that demands cleaner methods.
- Refineries globally are under pressure to reduce emissions and improve efficiency, with many investing in modernization projects.
- Older technologies often lead to increased operational costs due to higher energy consumption and maintenance needs.
- The European Union's environmental regulations, such as the Emission Trading System (ETS), penalize high-emission operations, increasing costs.
- According to the International Energy Agency (IEA), investment in refining capacity is projected to be around $600 billion between 2024 and 2030.
Segments Facing High Competition with Low Differentiation
In Hellenic Petroleum's BCG Matrix, Dogs represent segments with fierce competition and little differentiation. These are areas where HELLENiQ ENERGY struggles to stand out, leading to low returns. Think of specific product lines like gasoline or diesel where many competitors exist.
- Refining margins in Europe, including Greece, faced pressure in 2024.
- HELLENiQ ENERGY's profitability is sensitive to crude oil prices.
- Competition from other refiners in the Mediterranean region is high.
- Investments in renewable energy may offer future differentiation.
Underperforming Units: Strategic Review and Divestment
Hellenic Petroleum's Dogs represent segments with low market share and growth, such as older refining assets and some international marketing stations. In 2024, these areas faced pressure from fluctuating crude prices and intense competition, impacting profitability. Strategic review and potential divestment are crucial for reallocating resources from these underperforming units. Non-core operations also fit this category, demanding resources with limited returns.
| Dog Category | 2024 Performance Indicator | Strategic Implication | ||
|---|---|---|---|---|
| Legacy Refining Assets | Refining margins under pressure | Modernization or divestment | ||
| International Marketing Stations | Low market share/profitability | Review for improvement/sale | ||
| Non-core Operations | Limited returns on resources | Resource reallocation |
Question Marks
Hydrocarbon Exploration and Production
HELLENiQ ENERGY explores for hydrocarbons offshore Greece. This segment could see high growth. It requires considerable upfront investment and carries substantial risk. In 2024, exploration spending was influenced by fluctuating oil prices and regulatory updates. Discoveries could dramatically improve the company's valuation.
Large-Scale Renewable Energy Projects Under Development
Hellenic Petroleum has a robust renewable energy project pipeline, with over 5.2 GW in development. These projects, essential for future growth, require significant financial commitment. Success hinges on grid connections and favorable market conditions. The company aims to increase its renewable energy capacity.

Battery Energy Storage Systems (BESS)
HELLENiQ ENERGY is investing in battery energy storage (BESS). This positions them in a high-growth sector, vital for the energy transition. However, BESS tech and markets are still developing, marking it as a question mark. Global BESS capacity grew by 70% in 2024, but profitability varies.
Green Hydrogen Initiatives
Hellenic Petroleum is venturing into green hydrogen, a sector with high growth potential. The company is strategically investing in related projects. Despite being nascent, the market's early stage brings uncertainties and opportunities. This aligns with global trends toward sustainable energy.
- Hellenic Petroleum has allocated a significant portion of its capital expenditure towards renewable energy projects, including green hydrogen initiatives.
- Green hydrogen production costs are projected to decrease significantly by 2030, potentially making it more competitive with fossil fuels.
- The European Union aims to have 40 GW of electrolyzer capacity by 2030, indicating substantial growth potential for green hydrogen.
- Hellenic Petroleum's investments are influenced by government incentives and support for green hydrogen projects in Greece and the EU.
Electromobility Segment
HELLENiQ ENERGY is venturing into electromobility, a rapidly expanding market. While the e-mobility sector offers substantial growth potential, its current market share is likely modest. This positioning makes it a "question mark" in the BCG matrix. The company faces significant investment needs to establish a strong presence in this competitive landscape.
- HELLENiQ ENERGY's e-mobility investments are recent, with specific market share data still emerging.
- The e-mobility market's growth rate in Europe was approximately 15% in 2024.
- Competition includes established automakers and specialized EV companies.
High-Growth Ventures: A Look at the Future
Hellenic Petroleum's Question Marks are high-growth potential segments like offshore hydrocarbon exploration, renewables, battery energy storage, green hydrogen, and electromobility. These ventures require substantial investment with uncertain current market share and profitability. For instance, global BESS capacity grew 70% in 2024, and Europe's e-mobility market expanded by 15% in 2024, highlighting their dynamic yet developing nature.
| Segment | Growth Rate (2024) | Investment Need |
|---|---|---|
| BESS | 70% (Global) | High |
| Electromobility | 15% (Europe) | Significant |
| Green Hydrogen | Nascent/High Potential | Strategic |
BCG Matrix Data Sources
The BCG Matrix is fueled by Hellenic Petroleum's financial statements, market research, and competitor analyses for strategic insights.
