HealthEquity Boston Consulting Group Matrix
Fully Editable
Tailor To Your Needs In Excel Or Sheets
Professional Design
Trusted, Industry-Standard Templates
Pre-Built
For Quick And Efficient Use
No Expertise Is Needed
Easy To Follow
HealthEquity Bundle
Unlock Strategic Clarity
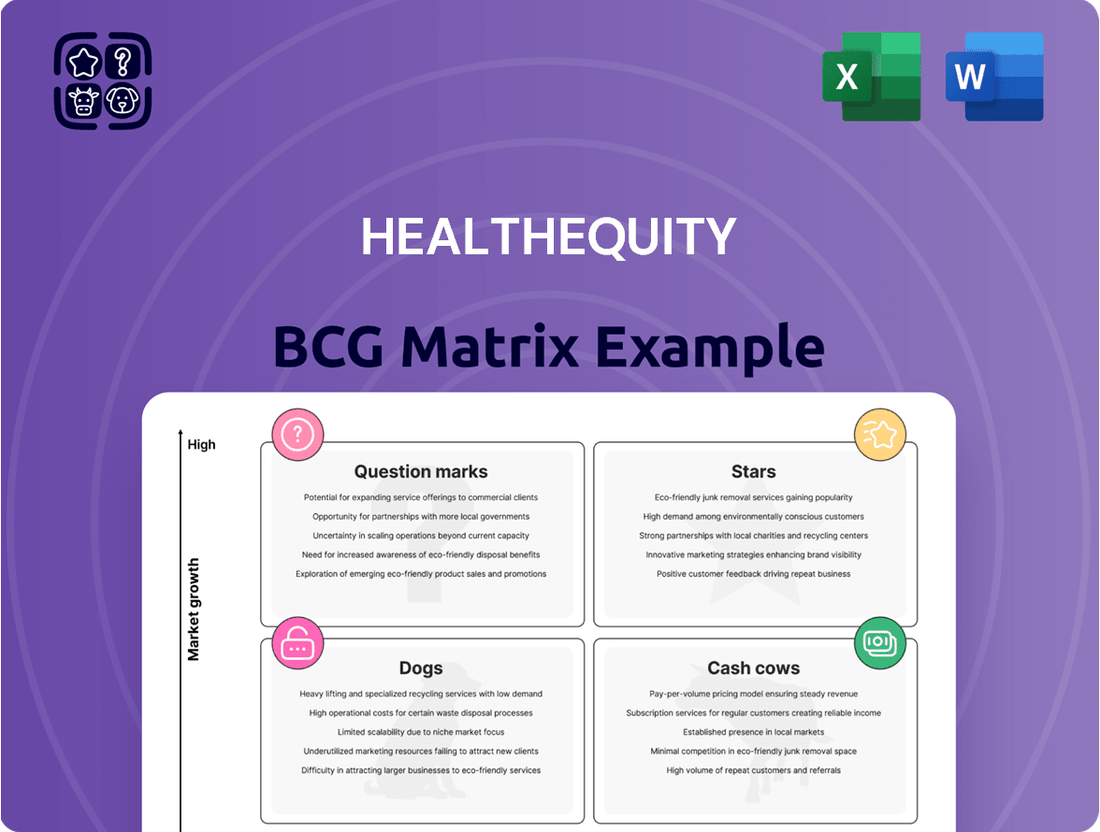
The HealthEquity BCG Matrix provides a critical snapshot of their product portfolio's market share and growth potential, highlighting which offerings are driving growth and which may need re-evaluation. Understanding these dynamics is key to strategic resource allocation and future success.
This preview offers a glimpse into the strategic positioning of HealthEquity's products. Purchase the full BCG Matrix for a comprehensive breakdown of their Stars, Cash Cows, Dogs, and Question Marks, complete with actionable insights to optimize your investment strategies.
Stars
Leading HSA Administration
HealthEquity stands out as a leader in Health Savings Account (HSA) administration, firmly placed in the Stars category of the BCG Matrix. As the nation's largest HSA custodian, the company commands a significant market share in a sector experiencing robust growth.
By the end of January 2025, HealthEquity managed an impressive 9.9 million HSAs. This figure represents a substantial 14% increase compared to the previous year, underscoring the company's continued success in attracting new members and solidifying its dominant position in the market.
Robust HSA Asset Growth
HealthEquity's Health Savings Account (HSA) assets have seen impressive growth, signaling strong market demand and the company's solid market standing. As of January 31, 2025, total HSA assets managed by HealthEquity reached $32.1 billion. This represents a significant 27% surge compared to the prior fiscal year, highlighting the accelerating adoption and funding of HSAs by consumers.

Expanding Investment HSAs
HealthEquity is seeing significant growth in its investment-focused Health Savings Accounts (HSAs). As of January 31, 2025, the company reported 753,000 HSAs with investment options, a substantial 23% increase from the previous year. This upward trend highlights members’ growing engagement with the investment features of their HSAs, which is a crucial factor in HealthEquity's expansion strategy.
Strategic Acquisition Integration
HealthEquity's strategic acquisition integration is a key driver of its market dominance, exemplified by the successful absorption of the BenefitWallet HSA portfolio. This move significantly boosted HealthEquity's HSA accounts and assets under administration, solidifying its leadership.
These integrations are not just about acquiring market share; they are about converting that acquired presence into consistent, long-term growth. By efficiently merging operations and customer bases, HealthEquity leverages these acquisitions to expand its reach and reinforce its competitive standing in the health savings account market.
- Acquisition Impact: HealthEquity's integration of BenefitWallet contributed to a substantial increase in its HSA market share.
- Growth Catalyst: The successful assimilation of acquired entities translates acquired market share into sustained asset and account growth.
- Market Consolidation: These strategic moves reinforce HealthEquity's leading position by consolidating its presence in the health benefits administration sector.
Record New HSA Sales
HealthEquity's HSA product is a clear Star in its BCG Matrix. The company reported a record one million new HSAs sold in fiscal year 2025, a testament to its robust sales execution and the enduring appeal of its core offerings.
This significant growth in new accounts reinforces HealthEquity's dominant position in a rapidly expanding market. The continuous influx of members into its HSA program directly contributes to its market share expansion, solidifying its Star status.
- Record HSA Sales: One million new HSAs sold in fiscal year 2025.
- Market Dominance: Demonstrates strong sales strategies and product demand.
- Star Status: Continuous market share expansion in a growing segment.
HSAs Soar: A 14% Growth Story!
HealthEquity's HSA product is a clear Star, boasting a substantial 14% year-over-year increase in HSAs, reaching 9.9 million by January 2025. This growth, fueled by strategic acquisitions like BenefitWallet and a record one million new HSAs sold in fiscal year 2025, solidifies its dominant position in a rapidly expanding market.
The company's total HSA assets surged by 27% to $32.1 billion as of January 31, 2025, indicating strong member engagement and market demand. Furthermore, HSAs with investment options grew by 23% to 753,000, highlighting members' increasing reliance on HealthEquity for wealth-building through HSAs.
| Metric | Value (as of Jan 31, 2025) | Year-over-Year Change |
| Total HSAs | 9.9 million | +14% |
| Total HSA Assets | $32.1 billion | +27% |
| HSAs with Investments | 753,000 | +23% |
| New HSAs Sold (FY25) | 1 million | N/A |
What is included in the product
The HealthEquity BCG Matrix analyzes its product portfolio's market share and growth rate to inform investment and divestment decisions.
Visualizes each health equity initiative's potential and market share, easing strategic allocation pain.
Cash Cows
Core Custodial Revenue
HealthEquity's core custodial revenue is a significant driver of its financial stability, stemming from the cash balances within its Health Savings Accounts (HSAs). This revenue stream is highly predictable due to the substantial and consistently growing asset base managed by the company.
For the fiscal year ending January 31, 2025, HealthEquity reported custodial revenue of $545.4 million. This figure underscores the immense value and reliability of managing these HSA assets, contributing a substantial portion to the company's overall financial performance.
Established Network Partnerships
HealthEquity's established network partnerships, boasting over 200 collaborators like health and retirement plan providers, are a significant asset. This mature distribution channel offers a stable, consistent influx of business for their core services.
These long-standing relationships mean HealthEquity can rely on a steady stream of clients without needing substantial new investment. In 2024, the company reported that its integrated platform serves over 16 million members, a testament to the reach and effectiveness of these established networks.

High Market Share in Mature CDBs
HealthEquity manages a substantial 7.1 million consumer-directed benefits (CDBs) beyond HSAs as of early 2025. These mature offerings, while not experiencing explosive growth, represent a significant and established customer base.
Within their respective market segments, these mature CDBs likely hold strong market positions. This high market share translates into consistent and reliable cash flow for HealthEquity.
The steady income generated by these established CDBs requires minimal additional marketing or promotional expenditure. This efficiency further solidifies their role as cash cows within the company's portfolio.
Efficient Operational Leverage
HealthEquity's strong operational leverage is a key driver of its Cash Cow status. In fiscal year 2025, the company is projected to achieve Adjusted EBITDA margins of 39% of revenue. This robust margin signifies exceptional efficiency in its core operations, enabling it to generate substantial cash flow relative to its revenue base.
This high level of profitability from its established business lines means HealthEquity is consistently producing more cash than it needs to reinvest, a hallmark of a Cash Cow. Such efficiency allows for significant free cash flow generation, which can then be utilized for other strategic initiatives or returned to shareholders.
- Strong Adjusted EBITDA Margins: Projected at 39% of revenue for FY25.
- Efficient Operations: Demonstrates the ability to convert revenue into significant cash.
- Cash Generation: Produces more cash than consumed, characteristic of a Cash Cow.
- Financial Flexibility: High cash flow supports strategic investments or shareholder returns.
Stable Interchange Revenue
HealthEquity's stable interchange revenue, a key component of its Cash Cow status within the BCG Matrix, is generated from transactions made using Health Savings Account (HSA) debit cards. This revenue stream is a reliable income source due to the substantial number of active accounts and the consistent transaction volume. In fiscal year 2025, HealthEquity reported $176.0 million in interchange revenue, underscoring its significance as a high-market-share, low-growth income generator.
- Stable Revenue Stream: Interchange revenue from HSA debit card transactions provides a predictable and consistent income for HealthEquity.
- Significant Contribution: In fiscal year 2025, this segment contributed $176.0 million to the company's overall revenue.
- High Market Share, Low Growth: This segment is characterized by its established position in the market with a steady, albeit not rapidly expanding, growth rate.
- Foundation of Cash Cow Status: The reliability and substantial contribution of interchange revenue solidify HealthEquity's position in the Cash Cow quadrant of the BCG Matrix.
Cash Cow: Predictable Revenue & High Margins
HealthEquity's core custodial revenue and interchange fees from HSA debit cards form its Cash Cow segment. These revenue streams are highly predictable due to a large, established customer base and consistent transaction volumes. The company's strong operational efficiency, evidenced by projected 39% Adjusted EBITDA margins for FY25, allows these mature business lines to generate substantial, reliable cash flow with minimal reinvestment needs.
| Revenue Source | FY25 Projection/Actual | Significance |
|---|---|---|
| Custodial Revenue | $545.4 million | Drives financial stability from HSA asset balances. |
| Interchange Revenue | $176.0 million | Generated from HSA debit card transactions, a reliable income. |
| Adjusted EBITDA Margin | 39% of revenue | Indicates high operational efficiency and cash generation capability. |
Delivered as Shown
HealthEquity BCG Matrix
The HealthEquity BCG Matrix preview you are viewing is the identical, fully formatted document you will receive immediately after purchase. This means you'll gain access to the complete strategic analysis without any watermarks or demo content, ensuring readiness for your business planning. The preview accurately represents the final report, offering a clear and professional tool for evaluating HealthEquity's product portfolio. You can confidently anticipate receiving this exact, analysis-ready file, prepared for immediate integration into your strategic decision-making processes.

Dogs
Runoff of Legacy CDB Activities
HealthEquity's mention of a runoff in National Emergency CDB activity directly impacts its service revenue growth. This indicates a strategic shift away from older, potentially less profitable consumer-directed benefit programs.
This decline in legacy CDB activities positions these offerings within the Dogs quadrant of the BCG matrix. They represent areas with low market growth and likely declining market share, requiring careful management to minimize losses.
Underperforming Acquired Platforms
HealthEquity's acquisition strategy has encountered hurdles, particularly with integrating acquired platforms. For instance, in 2023, the company reported that integration costs for prior acquisitions exceeded initial projections, leading to operational inefficiencies. This can result in underperforming assets, where acquired businesses struggle to gain market traction or realize expected synergies.

Services with Low User Engagement
Within HealthEquity's platform, certain features or supplementary services might consistently see low user engagement. These are offerings that, despite being available, struggle to attract significant adoption or market share within the broader health savings account (HSA) ecosystem. For instance, less utilized educational modules or niche investment options could fall into this category.
Outdated Technology or Features
In today's fast-paced digital world, healthcare technology is constantly advancing. Systems that fail to keep up with these changes, becoming outdated and unable to meet current user needs or regulatory standards, are prime candidates for the 'Dog' quadrant in the HealthEquity BCG Matrix. These legacy systems often represent a significant drain on resources, diverting funds and attention that could be better utilized for innovation and growth, ultimately hindering market share expansion.
The cost of maintaining outdated technology can be substantial. For instance, in 2024, the average IT budget for healthcare organizations dedicated to maintaining legacy systems was estimated to be between 60-70% of their total IT spend. This leaves less capital for investing in new, competitive solutions.
- Obsolescence Risk: Failure to update core platforms can lead to security vulnerabilities and compliance issues, as seen with the increasing number of cyberattacks targeting older, unpatched systems.
- User Dissatisfaction: Outdated interfaces and limited functionalities frustrate users, impacting efficiency and adoption rates for HealthEquity services.
- Competitive Disadvantage: Competitors offering modern, integrated solutions can attract and retain clients more effectively, eroding market share for those relying on legacy technology.
- High Maintenance Costs: Continued support for older software and hardware often incurs higher costs due to specialized expertise requirements and limited vendor support.
Niche Offerings with Limited Scalability
HealthEquity might categorize certain highly specialized consumer-directed benefits as 'Dogs' if they serve a very small, specific demographic and have limited potential for expansion. These offerings, perhaps tailored to unique medical conditions or niche employee groups, may struggle to gain substantial traction or generate significant revenue. For instance, a benefit designed exclusively for a handful of employees with a rare chronic illness might require substantial administrative overhead without a corresponding increase in user base or profitability.
These 'Dog' offerings are characterized by their low market share and low growth prospects within the broader health benefits landscape. They might operate at a break-even point or even incur net losses, consuming resources without contributing meaningfully to HealthEquity's overall growth. In 2024, if such a niche product had only 500 active users out of HealthEquity's millions, its contribution to the company's projected $1.1 billion in revenue for fiscal year 2024 would be negligible.
Examples of such niche offerings could include:
- Specialized wellness programs for extremely rare occupations.
- Benefits catering to extremely small, geographically isolated employer groups.
- Highly customized health savings account features for a minuscule segment of the population.
HealthEquity's 'Dogs': Low Growth, High Costs
HealthEquity's 'Dogs' represent offerings with low market growth and low market share, often requiring careful management to minimize losses or divestment. These can include legacy systems that are costly to maintain and struggle to keep pace with technological advancements, as well as niche benefit programs with limited user bases and expansion potential.
For instance, outdated IT infrastructure can consume significant resources, with healthcare organizations in 2024 allocating 60-70% of their IT budgets to maintaining legacy systems. This diverts funds from innovation and creates a competitive disadvantage. Similarly, highly specialized benefit programs serving only a tiny demographic, like a niche wellness program for a rare occupation, contribute negligibly to overall revenue, potentially representing less than 0.1% of HealthEquity's projected $1.1 billion revenue in fiscal year 2024.
These 'Dog' segments are characterized by their inability to attract significant adoption or market share, leading to user dissatisfaction and high maintenance costs. The risk of obsolescence, security vulnerabilities, and a competitive disadvantage further solidifies their position in this quadrant, necessitating strategic decisions regarding their future within the company's portfolio.
| Category | Characteristics | Example within HealthEquity | Financial Implication |
| Legacy Technology | Outdated, high maintenance costs, security risks | Unintegrated or older platform components | Drains IT budget (60-70% of healthcare IT spend in 2024 on legacy systems) |
| Niche Benefit Programs | Low user adoption, limited growth potential, small market share | Highly specialized wellness programs for rare occupations | Negligible revenue contribution (e.g., <0.1% of projected FY24 revenue) |
| Underperforming Acquired Assets | Failed integration, poor market traction, unrealized synergies | Acquired platforms struggling to gain market share post-acquisition | Increased integration costs exceeding projections (reported in 2023) |
Question Marks
Health Payment Accounts (HPAs)
HealthEquity's new Health Payment Accounts (HPAs), a collaboration with Paytient, target a burgeoning market for adaptable healthcare payment solutions. This initiative positions HPAs as a potential high-growth product, tapping into a segment still in its early stages of development.
Given their recent introduction, HPAs currently hold a modest market share. However, with strategic investment and increasing consumer acceptance, they have the potential to ascend to 'Star' status within the health payment landscape.
AI-Driven Expedited Claims Tool
The AI-Driven Expedited Claims tool, still in limited release as of 2024, is positioned to disrupt health savings account administration. By using AI to simplify receipt uploads and minimize mistakes, it targets a high-growth market with the potential to significantly enhance member satisfaction and operational efficiency.
While the tool's innovative capabilities suggest a promising future, its current market penetration is minimal. This early stage of development and adoption places it in a position where further investment and market expansion are key to realizing its full potential, aligning with a strategic focus on growth.

New AI-Powered HSA Information Tools
HealthEquity introduced an AI-powered information tool in October 2024, designed to offer instant responses to Health Savings Account (HSA) and consumer-directed benefits inquiries. This initiative reflects a strategic move to leverage artificial intelligence for improved user engagement and simplified navigation within complex benefits landscapes. The tool directly addresses the increasing consumer preference for immediate, digital self-service options.
Emerging Cost Transparency Solutions
HealthEquity's strategic focus on cost transparency through technology and cost containment for 2025 signals a significant push into emerging solutions. This indicates potential new product development or strategic initiatives aimed at addressing rising healthcare expenses.
These areas represent high-growth opportunities within healthcare finance. For instance, the U.S. healthcare spending reached an estimated $4.5 trillion in 2023, highlighting the immense market need for cost-saving measures. HealthEquity's move suggests they are positioning themselves to capture a share of this market, likely through innovative technological platforms that empower consumers and employers with clearer pricing information.
- Technology-driven cost transparency: Solutions that leverage data analytics and digital platforms to provide clear, upfront pricing for healthcare services.
- Cost containment strategies: Initiatives and tools designed to reduce overall healthcare expenditure for individuals and employers.
- Market potential: The U.S. healthcare market is vast, with significant room for growth in cost-efficiency solutions.
- Early-stage development: HealthEquity's specific offerings in these nascent areas are likely still being refined and scaled.
Enhanced Benefit Engagement Strategies
HealthEquity is focusing on increasing benefits engagement for 2025, especially for employees who are typically harder to reach. This suggests a strategic push towards new programs or technology designed to boost how employees use their benefits. This area represents a significant growth opportunity within benefits administration.
The company's commitment to enhancing engagement signals a recognition of the critical need for employees to fully utilize their health and financial wellness benefits. For instance, in 2024, many employers reported challenges in getting employees to actively participate in wellness programs, with participation rates often hovering below 30% for certain initiatives. HealthEquity's move is a direct response to this widespread issue.
- Targeted Communication: Implementing personalized communication strategies based on employee demographics and benefit usage patterns.
- Digital Tools and Platforms: Leveraging mobile apps and user-friendly online portals to simplify benefit access and education.
- Incentive Programs: Developing reward systems for employees who actively engage with and utilize their benefits.
- Financial Wellness Education: Offering resources and workshops focused on maximizing the value of benefits like HSAs and FSAs.
Strategic Bets: Navigating Healthcare's Future
HealthEquity's initiatives in technology-driven cost transparency and cost containment for 2025, alongside efforts to increase benefits engagement, represent strategic moves into high-growth areas. These are positioned as 'Question Marks' because, while the market potential is substantial, as evidenced by the $4.5 trillion U.S. healthcare spending in 2023, their specific product development and market penetration in these nascent areas are still in early stages. Further investment and market expansion are critical for these ventures to mature and potentially become market leaders.
| Initiative | BCG Category | Rationale | Market Potential | Current Status |
|---|---|---|---|---|
| AI-Driven Expedited Claims | Question Mark | Disruptive technology for HSA administration, high-growth market | Significant efficiency gains and member satisfaction | Limited release in 2024, minimal market penetration |
| AI-Powered Information Tool | Question Mark | Addresses demand for instant, digital self-service in benefits | Improved user engagement and simplified navigation | Launched October 2024, early adoption phase |
| Cost Transparency & Containment | Question Mark | Addresses rising healthcare costs with technological solutions | Vast market opportunity within U.S. healthcare spending | Emerging solutions, likely in development/scaling phase |
| Benefits Engagement (Hard-to-Reach Employees) | Question Mark | Tackles low participation rates (often <30% for some initiatives in 2024) | Significant growth opportunity in benefits administration | Strategic push for new programs/technology |
BCG Matrix Data Sources
Our HealthEquity BCG Matrix is constructed using a blend of proprietary market data, public financial disclosures, and insights from healthcare industry research, ensuring a comprehensive view.
