Big Lots Boston Consulting Group Matrix
Fully Editable
Tailor To Your Needs In Excel Or Sheets
Professional Design
Trusted, Industry-Standard Templates
Pre-Built
For Quick And Efficient Use
No Expertise Is Needed
Easy To Follow
Big Lots Bundle
Visual. Strategic. Downloadable.
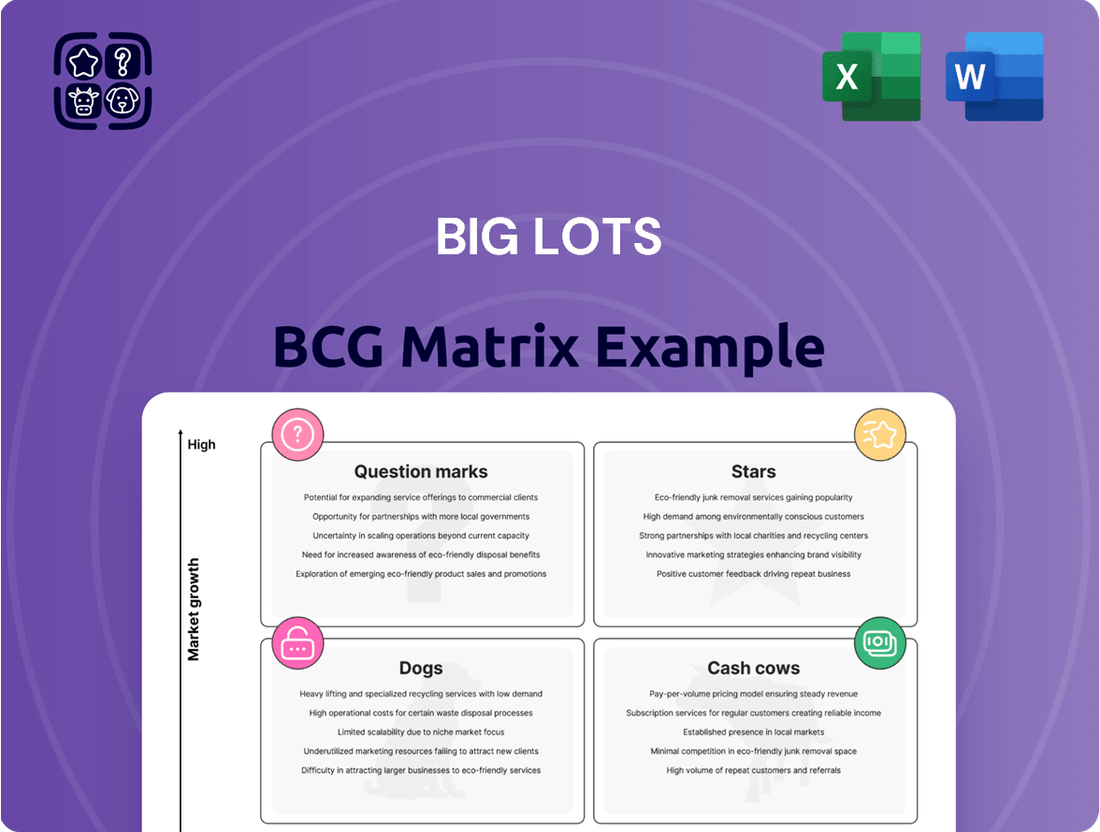
Big Lots operates in a dynamic retail landscape. Its product portfolio likely includes various categories, from furniture to food. Understanding where each category fits within the BCG Matrix is crucial. Are there 'Stars' driving growth or 'Dogs' that need managing? Identifying 'Cash Cows' helps sustain investment.
This overview only scratches the surface. Purchase the full BCG Matrix for a complete breakdown and strategic insights you can act on.
Stars
Furniture and Home Decor (Historically)
Historically, furniture and home decor have been crucial for Big Lots, contributing about 30% of its sales, as of a 2025 report. Although consumer spending on these items decreased recently, this segment is a key area for market share. In 2024, the home and furniture market showed some volatility. Big Lots aims to adapt to these shifts.
Broyhill Brand
Big Lots' acquisition of Broyhill aimed to boost its furniture offerings. This move allowed them to provide better quality items at competitive prices. Broyhill, as a private label, could enhance profit margins. In 2024, Big Lots reported net sales of $3.78 billion, with a focus on value-driven brands.

Extreme Bargains and Closeouts (Potential)
Big Lots is focusing on extreme bargains and closeouts, aiming for over 75% of sales from these items by the close of 2024. This strategic shift could become a key strength. In 2023, closeout sales represented a significant portion, though not yet 75%. Success hinges on consistent sourcing and attractive margins.
Seasonal Items (Historically)
Seasonal items have been a consistent part of Big Lots' revenue, often making up about 20% of sales. Strong sales in these categories, particularly during holidays, can significantly impact the company's performance. In 2024, Big Lots' seasonal offerings included outdoor furniture and holiday decorations, which saw varying sales trends. The cyclical nature of this segment means performance fluctuates with the seasons.
- Seasonal items typically represent around 20% of Big Lots' sales.
- Success in seasonal categories can provide a revenue boost.
- Seasonal offerings include holiday items and outdoor furniture.
- Sales trends are influenced by seasonal demand.
Store Reopenings Under New Ownership (Potential)
Big Lots, under new ownership, is actively reopening stores, a strategic move to revitalize its market presence. If these relaunched stores perform well, attracting customers with a new approach, they could become Stars. This shift hinges on successfully implementing a fresh assortment and strategy to boost sales and brand recognition. For example, in 2024, Big Lots plans to reopen approximately 50 stores. This strategic move signals a potential growth phase if executed effectively.
- Store Reopenings: Approximately 50 stores planned for reopening in 2024.
- Strategic Focus: Implementation of a refreshed assortment and strategy is key.
- Market Impact: Successful reopenings could lead to increased market presence.
- Financial Goal: Aim to attract customers and boost sales through new initiatives.
Reopening Strategy: Could Stores Shine?
Big Lots' strategic reopening of approximately 50 stores in 2024 positions them as potential Stars within the BCG Matrix. This initiative targets significant sales growth and market presence through a refreshed strategy. Success here hinges on attracting customers with a new assortment and driving increased revenue. If these relaunched stores perform well, they could become key drivers of future growth.
| Category | 2024 Initiative | Potential BCG Status |
|---|---|---|
| Store Reopenings | ~50 stores planned | Potential Star |
| Strategic Focus | Refreshed assortment | High Growth |
| Market Impact | Increased market presence | Enhanced Sales |
What is included in the product
Big Lots' BCG Matrix overview, analyzing its product portfolio across quadrants for strategic investment, hold, or divest decisions.
Clean, distraction-free view optimized for C-level presentation of Big Lots' BCG Matrix, focusing on key data.
Cash Cows
Everyday Consumables and Food
Everyday consumables and food are strong cash cow candidates for Big Lots. These items see consistent demand, even during economic downturns. They provide steady cash flow, although margins may be lower compared to other product categories. In 2024, these items represent about 15% of Big Lots' sales, offering a reliable revenue stream.
Established Store Locations (Select)
Even with store closures, some Big Lots locations likely act as cash cows. These stores generate consistent revenue, supported by loyal customers. In 2024, despite challenges, some locations may still be profitable. They provide funds to support other business areas.

Supply Chain and Sourcing Efficiency (If Achieved)
Big Lots' sourcing strategy, focusing on closeouts and direct imports, is key. Optimized supply chains and strong supplier relationships can lead to consistent margins. This is a reliable cash flow source, especially in a slow market. In 2024, Big Lots aimed to reduce inventory by $200 million.
Operational Cost Management (If Effective)
Big Lots' cost reduction efforts are crucial. Effective operational cost management can significantly boost cash flow and profitability. Consider the impact of reduced expenses on the bottom line. Even with slow growth, streamlined operations enhance financial performance.
- In Q1 2024, Big Lots reported a gross margin of 29.3%, indicating potential for improvement through cost control.
- Big Lots aims to reduce SG&A expenses, which were $387.4 million in Q1 2024.
- Successful cost-cutting could lead to increased free cash flow, vital for debt reduction.
Private Label Expansion (If Successful)
Expanding private label offerings can boost margins, as seen with the Broyhill brand, offering a profitable alternative to national brands. If Big Lots successfully grows private label sales, particularly in mature categories, these could become reliable cash cows. This strategy enhances profitability, a key focus for 2024. Big Lots' focus on private labels aligns with consumer demand for value, driving sales.
- Private label expansion can lead to higher profit margins.
- Successful growth in mature categories is key.
- This strategy is a focus for 2024.
- Aligns with consumer demand for value.
Cash Flow Champions: Unpacking the Financial Strategy
Big Lots' cash cows are rooted in stable segments like everyday consumables, contributing about 15% of 2024 sales, and consistently profitable store locations. These areas provide reliable cash flow, crucial for operations. Strategic cost reduction efforts, targeting SG&A expenses, also enhance cash generation. Furthermore, expanding private label offerings aims to boost gross margins, as seen with the 29.3% gross margin in Q1 2024.
| Cash Cow Area | Key Metric | 2024 Data |
|---|---|---|
| Everyday Consumables | Sales Contribution | ~15% of 2024 Sales |
| Operational Efficiency | Q1 2024 Gross Margin | 29.3% |
| Cost Management | Q1 2024 SG&A Expenses | $387.4 Million |
What You’re Viewing Is Included
Big Lots BCG Matrix
The preview you see is identical to the BCG Matrix document you'll download after purchase. It’s a fully functional, ready-to-use analysis tailored for Big Lots, without any watermarks or extra content.

Dogs
Underperforming Store Locations
Big Lots has closed stores, a key sign of underperformance. These locations likely had low market share and were a drain on resources. In 2024, Big Lots reported a net loss of $168.7 million. Underperforming stores consume resources without sufficient returns.
Product Categories with Declining Sales
Certain product categories, such as furniture, are experiencing sales declines at Big Lots. These high-ticket, discretionary items face decreased consumer spending, especially in the current economic climate. Such categories likely have low growth prospects. For instance, Big Lots' 2024 sales showed a notable shift in consumer preferences.

Inefficient or Outdated Operational Processes
Inefficient processes, like those in Big Lots' supply chain or store operations, can be a drag. This inefficiency often leads to poor profitability, a key trait of a Dog in the BCG Matrix. For example, in 2024, Big Lots faced challenges in inventory management. This resulted in markdowns that impacted their bottom line.
Segments with Intense Competition and Low Differentiation
In the Big Lots BCG Matrix, segments with intense competition and low differentiation, coupled with low market share, are categorized as "Dogs." Big Lots faces challenges competing with larger retailers and specialized discounters in these areas. These segments often struggle to generate significant profits or growth. For instance, in 2024, Big Lots reported a net sales decrease, indicating challenges in competitive markets.
- Intense competition from larger retailers.
- Low differentiation in product offerings.
- Struggles to generate profits.
- Net sales decrease in 2024.
Legacy Inventory and Merchandise Issues
Big Lots' "Dogs" category faces legacy inventory and merchandise challenges. Issues with inventory management, especially excess or undesirable closeout merchandise, tie up capital. This leads to markdowns, diminishing value. In 2024, Big Lots reported a net sales decrease, indicating the impact of inventory issues.
- Inventory challenges impact profitability.
- Closeout merchandise often yields low returns.
- Markdowns reduce profit margins significantly.
- Inefficient inventory management ties up capital.
Struggling Segments: Financial Strain and Market Share Woes
Big Lots' Dogs category encompasses underperforming segments with low market share and growth prospects. This includes declining sales in certain product lines and inefficient operations, which drain resources. In 2024, Big Lots reported a net loss of $168.7 million, reflecting challenges from intense competition and legacy inventory issues. These areas struggle to generate significant profits or growth for the company.
| Metric | 2024 Performance | Implication (Dogs) |
|---|---|---|
| Net Loss | $168.7 million | Underperforming segments drain profitability. |
| Net Sales | Decreased | Indicates low market share and competitive struggles. |
| Inventory Management | Challenges | Leads to markdowns, tying up capital. |
Question Marks
E-commerce and Omnichannel Capabilities
Big Lots recognizes the need to boost its e-commerce and omnichannel strategies. However, its digital presence is a Question Mark. In 2024, online retail sales grew, yet Big Lots' market share is low. For example, in Q1 2024, e-commerce sales increased by 15%.
New Store Formats/Locations (Under New Ownership)
Big Lots' strategy under new ownership includes reopening stores and considering smaller formats. These new or reopened locations are question marks. Their ability to capture market share is uncertain. For instance, Big Lots had approximately 1,378 stores as of early 2024.

Expansion into New Product Categories (e.g., Health and Wellness)
Big Lots expanded into health and wellness categories, marking them as "Question Marks" in their BCG matrix. These new ventures have uncertain market share and growth potential. Big Lots invested in these areas, aiming to boost sales. In 2024, Big Lots' net sales were $4.4 billion, showing the need for strategic investments in new categories. The success of these expansions will define their future.
Targeting New Customer Bases
Big Lots' move to attract new customer bases is a Question Mark in its BCG matrix. Focusing on different demographics means changing marketing and products, with an unclear impact on market share. This strategy involves risk since it is uncertain how successful the company will be in attracting new customers. For example, in 2024, Big Lots saw a 15.7% decrease in sales.
- Marketing adjustments are crucial for reaching new customers, including digital marketing.
- Merchandising changes are required to match the preferences of new customer segments.
- Market share gains depend on successful execution and customer acceptance.
- The high level of uncertainty shows the risks involved in this strategy.
Revamped Product Assortment Strategy
Big Lots' revamped product strategy, emphasizing bargains, places it in the "Question Mark" quadrant of the BCG matrix. This strategy aims to boost sales by focusing on closeouts and extreme value items. The success of this move hinges on effective execution and market response, especially amid strong competition. For instance, in 2024, Big Lots reported a net sales decrease of 6.2% to $4.7 billion.
- Focus on bargain penetration is a key strategy.
- Success depends on market share gains.
- Intensified focus on closeouts is the core.
- Execution and market reception are crucial.
Supply Chain Investments: A Risky Gamble?
Big Lots' investments in supply chain enhancements are Question Marks. These initiatives, like optimizing inventory or improving logistics, require significant capital and have uncertain short-term market share gains. For example, Big Lots' operating expenses were $1.3 billion in Q1 2024, reflecting ongoing operational investments. The success of these efforts in boosting efficiency and sales remains to be seen.
| Area | Investment | 2024 Data |
|---|---|---|
| Supply Chain | Logistics optimization | Operating expenses $1.3B (Q1 2024) |
| Inventory | Efficiency improvements | Inventory $890M (Q1 2024) |
| Distribution | Network upgrades | Future growth potential unknown |
BCG Matrix Data Sources
Big Lots' BCG Matrix utilizes financial statements, market analysis, and industry reports, providing a robust base for our strategic evaluation.
