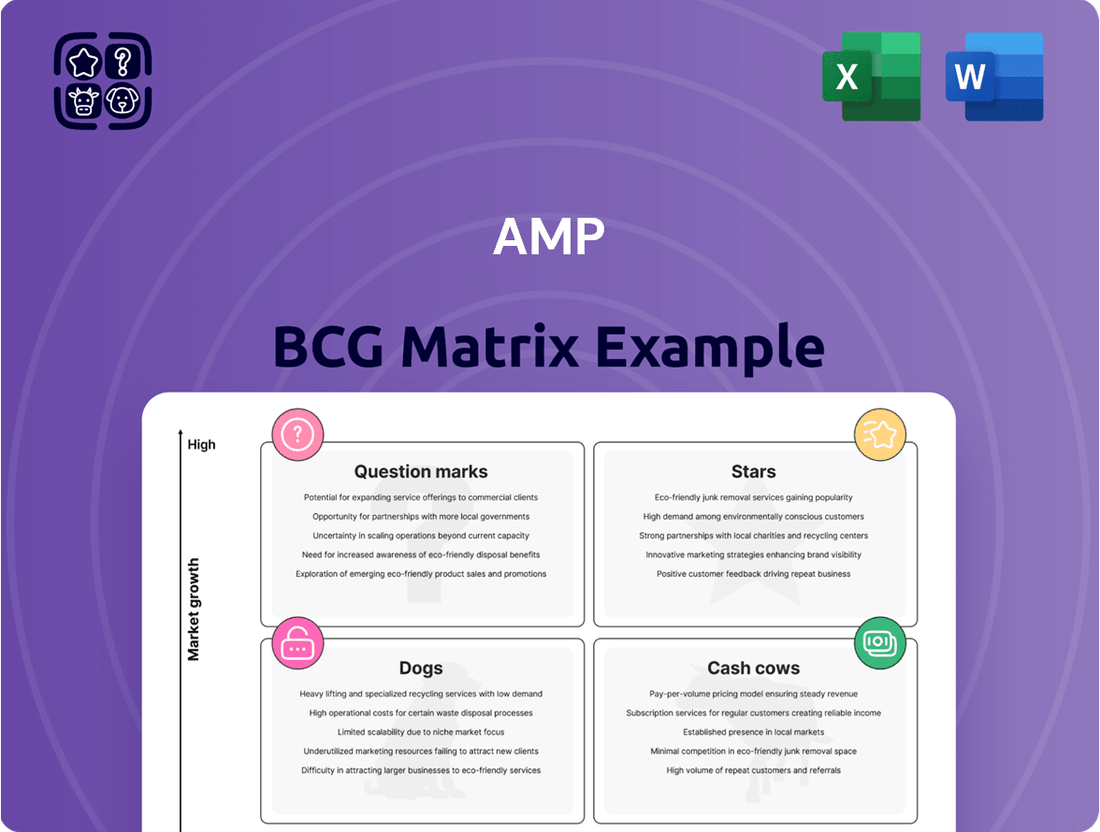
AMP Boston Consulting Group Matrix
Fully Editable
Tailor To Your Needs In Excel Or Sheets
Professional Design
Trusted, Industry-Standard Templates
Pre-Built
For Quick And Efficient Use
No Expertise Is Needed
Easy To Follow
GET THE FULL COMPANY
ANALYSIS BUNDLE FOR
AMP
See the Bigger Picture
Uncover the strategic positioning of this company's product portfolio with our insightful BCG Matrix overview. Understand how each product fits into the Stars, Cash Cows, Dogs, or Question Marks quadrants, revealing critical areas for growth and divestment. This preliminary glimpse highlights potential opportunities and challenges within the market landscape. Don't miss out on the full strategic advantage; purchase the complete BCG Matrix for detailed analysis and actionable recommendations.
Stars
North Platform Managed Portfolios
AMP's North Platform Managed Portfolios are a significant growth driver, evidenced by their Assets Under Management (AUM) soaring past $14 billion as of February 2024. This represents a remarkable 66% surge year-over-year, highlighting strong investor confidence and market adoption.
The platform's financial health is further bolstered by a substantial increase in net cash flows, which grew by an impressive 96.7% to $2.8 billion in the fiscal year 2024. This upward trend is primarily fueled by increased inflows into its managed portfolio solutions.
This robust performance positions North Platform Managed Portfolios as a key contributor to AMP’s overall strategy, capturing a growing segment of the wealth management market. The platform’s success is further validated by industry accolades, including 'Most Improved Platform' and 'Best Retirement Solution'.
Digital Advice Solutions (AMP Super)
AMP's newly launched digital advice solution for its Super members represents a significant step in addressing the increasing need for straightforward, no-cost retirement guidance. This digital platform is designed to be user-friendly, making financial planning more accessible to a broader audience.
The uptake of this digital advice tool is already showing positive effects. In the first quarter of 2025, it contributed to better cash flow trends and a reduction in outflows within AMP's Superannuation & Investments business. This suggests the solution is resonating with members and is a key part of AMP's strategy in the expanding retirement planning sector.

Retirement Income Products
Retirement income products are a key focus for AMP as it aims to become Australia's top retirement specialist. This strategy leverages the increasing superannuation assets, which reached over AUD 3.8 trillion by the end of 2023, and a rapidly ageing population. AMP's innovative offerings, such as MyNorth Lifetime, are attracting significant adviser attention and boosting the North platform's expansion, signalling a vibrant growth area where AMP is seeking to establish dominance.
Superannuation Investment Performance
Superannuation investment performance is a critical factor for AMP's competitive standing. By the close of 2024, several AMP MySuper options demonstrated impressive growth, with some achieving returns exceeding 15%. This level of performance positions these options within the top quartile of superannuation offerings.
This robust investment performance directly impacts AMP's financial health. Strong returns help to mitigate customer outflows and bolster cash flows, which are vital for sustained operations and growth. It signifies a solid competitive advantage within the substantial and expanding superannuation market.
- Top Quartile Returns: AMP's MySuper options achieved over 15% returns by end of 2024 in some cases.
- Cash Flow Impact: Strong performance helps to reduce customer withdrawals and improve cash flow.
- Market Position: This success reinforces AMP's competitive strength in a large and growing market.
New Zealand Wealth Management
AMP's New Zealand Wealth Management segment is a standout performer. In fiscal year 2024, it delivered an impressive 8.8% rise in underlying Net Profit After Tax (NPAT). This growth was fueled by a strategic focus on diversifying its revenue streams and maintaining tight control over operational costs.
While precise market share data isn't always granular, the consistent positive financial trajectory of AMP's New Zealand operations indicates a robust position within a growing regional market. This suggests it's a strong contender with ample opportunity for further expansion and development.
- FY24 Underlying NPAT Growth: 8.8% increase.
- Key Drivers: Revenue diversification and disciplined cost management.
- Market Position: Strong performer in a growing regional market.
- Future Outlook: Potential for continued growth and development.
Superannuation Soars: High Returns, High Growth!
Stars in the BCG Matrix represent offerings with high market share in a rapidly growing industry. AMP's Superannuation investment performance, with some MySuper options achieving over 15% returns by the close of 2024, places them in this category. This strong performance not only attracts new investors but also helps retain existing ones, contributing to AMP's overall market strength.
What is included in the product
The AMP BCG Matrix analyzes a company's portfolio by product, detailing strategic actions for Stars, Cash Cows, Question Marks, and Dogs.
Quickly identify underperforming units with a clear, quadrant-based visual.
Cash Cows
Traditional Superannuation Products (Legacy)
AMP's legacy superannuation products, despite some client departures, still hold substantial weight with $56.4 billion in assets under management by the close of 2024. This segment continues to be a reliable generator of cash, even with a slight dip in revenue margins, as strategies to keep existing clients are showing positive cash flow trends. It’s a mature segment, but its consistent cash generation firmly places it in the cash cow category.
AMP Bank's Core Lending Portfolio (Residential Mortgages)
AMP Bank's residential mortgage portfolio, a cornerstone of its operations, demonstrated resilience in 2024. Despite some pressure on lending margins, this segment experienced a welcome return to growth in the second half of the year, indicating sustained demand and effective market positioning.
This mature business line, while not a high-growth engine, serves as a reliable cash generator for AMP. Its stability is crucial, providing a predictable revenue stream that underpins the company's overall financial health and operational capacity.
Crucially, AMP's mortgage book maintained strong credit quality throughout 2024. This focus on asset quality is paramount, mitigating risk and reinforcing the portfolio's status as a dependable cash cow for the organization.

Platforms Business (excluding Managed Portfolios)
The broader Platforms business, excluding managed portfolios, demonstrated robust performance in FY24, achieving an underlying NPAT of $107 million. This represents a substantial 18.9% increase, highlighting the segment's strong growth trajectory.
This segment acts as a crucial anchor, not only facilitating high-growth products but also housing mature wrap platform services. These mature services are vital, consistently generating fee income from a substantial asset base, thereby solidifying their role as a reliable cash contributor.
Investment Management for Retail Clients (Non-Platform)
AMP's investment management for retail clients, outside of its platform offerings, represents a stable contributor to its financial performance. These services, spanning diverse asset classes, generate consistent cash flow even without exceptional growth rates, characteristic of mature markets.
The steady nature of asset management for these retail clients positions these products as cash cows within the AMP BCG matrix. This segment provides reliable revenue streams that can fund other strategic initiatives or investments.
- Stable Revenue Generation: AMP's retail investment management services, while not experiencing high growth, consistently bring in revenue through management fees and other associated charges.
- Mature Market Dynamics: Operating in a mature market means these products benefit from established client bases and predictable demand, ensuring a steady cash inflow.
- Contribution to Profitability: The consistent cash flow from these managed investments directly supports AMP's overall profitability, providing a financial cushion.
- Funding for Growth: The cash generated from these 'cash cow' products can be strategically reinvested into higher-growth areas of the business, such as digital platforms or emerging investment products.
Existing Deposit Base (AMP Bank)
AMP Bank's existing deposit base is a clear cash cow. In Q1 2024, total deposits reached $21.4 billion, illustrating a substantial and stable funding source.
This robust deposit base is fundamental to AMP Bank's operations. It functions as a cost-effective way to secure funds, directly supporting its lending operations and contributing significantly to net interest income, a hallmark of a cash cow in the banking industry.
- Stable Funding: $21.4 billion in total deposits as of Q1 2024.
- Low-Cost Funds: Deposits represent a cheaper alternative to wholesale funding.
- Income Generation: Drives net interest income through lending activities.
- Operational Stability: Underpins the bank's core lending and financial services.
AMP's Cash Cows: Stable Revenue Streams
AMP's legacy superannuation products, representing $56.4 billion in assets under management by the close of 2024, are a prime example of cash cows. Their consistent cash generation, despite slight margin dips, fuels other business areas.
The AMP Bank's mortgage portfolio, boasting strong credit quality, provides a stable revenue stream, bolstering AMP's financial health. Similarly, the Platforms business, with its mature wrap services, reliably generates fee income, acting as a dependable cash contributor.
AMP's retail investment management and its substantial $21.4 billion deposit base as of Q1 2024 for AMP Bank are also clear cash cows. These segments offer stable funding and consistent cash flow, underpinning operational stability and profitability.
| Business Segment | 2024 AUM/Deposits | Cash Cow Characteristics | Financial Contribution |
|---|---|---|---|
| Legacy Superannuation | $56.4 billion | Mature market, stable cash flow | Funds strategic initiatives |
| Mortgage Portfolio | Undisclosed (strong credit quality) | Predictable revenue stream | Underpins financial health |
| Platforms (Mature Services) | Undisclosed (robust FY24 NPAT) | Consistent fee income | Reliable cash contributor |
| Retail Investment Management | Undisclosed | Steady asset growth, consistent cash flow | Supports overall profitability |
| AMP Bank Deposits | $21.4 billion (Q1 2024) | Stable, low-cost funding | Drives net interest income |
Delivered as Shown
AMP BCG Matrix
The AMP BCG Matrix preview you're currently viewing is the identical, fully completed document you will receive immediately after completing your purchase. This means you can confidently assess the quality and content, knowing that no watermarks or demo elements will be present in the final file. You'll gain instant access to a professionally structured strategic tool, ready for immediate application in your business analysis and decision-making processes.

Dogs
Financial Advice Licensee Businesses
AMP's financial advice licensee businesses were officially sold in December 2024. This segment had been a consistent drain on the company's finances, reporting underlying net profit after tax (NPAT) losses prior to the sale.
The divestment clearly positions these businesses as a 'Dog' within the BCG framework. They exhibited both a low market share and limited growth potential, making them an unattractive area for AMP to allocate further resources.
The strategic decision to exit this segment underscores AMP's focus on optimizing its portfolio by shedding underperforming assets. This move is aimed at improving overall profitability and concentrating on more promising business areas.
Underperforming Legacy Products
Underperforming legacy products, often older superannuation or investment offerings, can significantly drag down a company's financial performance. These products typically exhibit persistently negative net cash flows and a shrinking market share, even when the broader market or other product lines are improving. In 2024, for instance, some financial institutions reported that their legacy platforms continued to experience net outflows, contributing to higher operational costs without generating proportional revenue.
The core issue with these underperforming legacy products often lies in their lack of competitiveness. They may have higher fees compared to newer, more agile offerings, or their investment performance has lagged behind benchmarks. This makes them unattractive to new customers and often prompts existing clients to transfer their funds elsewhere, exacerbating the negative cash flow situation.
For AMP, any legacy superannuation or investment products that consistently show negative net cash flows or a declining market share would be classified as underperforming legacy products. These are likely the products that are not competitive on fees or performance and are contributing to overall outflows, hindering the company's ability to invest in growth areas.

Certain Fixed-Rate Loan Portfolios (AMP Bank)
AMP Bank's fixed-rate loan portfolios faced margin compression in FY24, impacting its net interest margin. This was largely driven by the shift of fixed-rate loans to variable rates, coupled with intense market competition.
These segments, especially if showing persistent margin compression or declining demand without significant digital uplift, could be classified as Dogs within the BCG Matrix.
For instance, if a specific portfolio's NIM fell below the bank's cost of capital and showed no clear path to improvement, it would fit the Dog category.
This classification highlights areas requiring strategic review, potentially leading to divestment or restructuring to improve overall portfolio health.
Non-Core or Divested Assets
Following the divestment of AMP Capital and SuperConcepts in the first half of fiscal year 2023, these entities would be categorized as divested assets within the AMP portfolio. This strategic exit aligns with AMP's broader strategy of simplifying its business structure and focusing on core operations. For instance, the sale of AMP Capital alone generated approximately AUD 1.35 billion in capital.
These divested assets no longer contribute to AMP's ongoing revenue streams or strategic objectives. Their classification reflects a deliberate move to streamline the company's operational footprint and enhance financial performance by shedding non-core or underperforming businesses.
- Divested Assets: AMP Capital and SuperConcepts, sold in FY23.
- Strategic Rationale: Portfolio simplification and focus on core businesses.
- Financial Impact: Sale of AMP Capital contributed approximately AUD 1.35 billion in capital.
- Current Status: No longer part of AMP's active operational portfolio.
High-Cost, Low-Efficiency Operations
High-cost, low-efficiency operations within AMP's structure are those business segments or processes that demand significant controllable expenses or investment in simplification without a clear, near-term prospect of generating commensurate revenue or profit. These areas can act as a drag on overall performance, consuming resources that could be better allocated elsewhere.
AMP has been strategically addressing these inefficiencies as part of its broader operational improvement initiatives. For instance, in their 2024 financial reporting, AMP highlighted a concentrated effort to streamline back-office functions, which historically represented a disproportionate cost base relative to their direct revenue contribution. The company's commitment to simplification is a key driver in enhancing overall profitability and operational agility.
- Operational Inefficiencies: Segments requiring high controllable costs without clear revenue alignment.
- Business Simplification Spend: Investments in simplifying complex processes that don't yield immediate returns.
- Profitability Path: Lack of a defined strategy to improve financial performance in these areas.
- Cost Reduction Efforts: AMP's active pursuit of reducing expenses in these specific operational units.
AMP's "Dogs": Shedding Underperformers for Growth
Dogs in the AMP BCG Matrix represent business segments or products with low market share and low growth potential. These are typically underperforming areas that consume resources without generating significant returns. AMP's sale of its financial advice licensee businesses in December 2024 exemplifies this classification, as these segments consistently reported losses and offered limited future growth prospects.
The divestment of these "Dog" segments is a strategic move to streamline AMP's portfolio and redirect capital towards more promising opportunities. By shedding these low-performing assets, AMP aims to improve overall profitability and operational efficiency. This focus on simplification and shedding underperforming units is a key strategy for enhancing financial performance.
Underperforming legacy products, such as older superannuation or investment offerings, often fit the Dog category due to their declining market share and lack of competitiveness. These products can contribute to negative cash flows and higher operational costs, similar to the issues seen with AMP's financial advice businesses prior to their sale.
AMP Bank's fixed-rate loan portfolios, particularly those experiencing persistent margin compression without a clear path to improvement, could also be classified as Dogs. Such segments require strategic review, often leading to divestment or restructuring to enhance the overall health of the company's asset base.
| Segment | BCG Classification | Rationale | 2024 Financial Impact |
|---|---|---|---|
| Financial Advice Licensee Businesses | Dog | Low market share, low growth potential, consistent NPAT losses. | Sold in December 2024. |
| Underperforming Legacy Products | Dog (Potential) | Shrinking market share, negative net cash flows, lack of competitiveness. | Reported net outflows and higher operational costs for some institutions in 2024. |
| Certain AMP Bank Loan Portfolios | Dog (Potential) | Margin compression, declining demand, below cost of capital. | Margin compression impacting Net Interest Margin (NIM) in FY24. |
Question Marks
New Digital Bank (Small Business and Consumer)
AMP's new digital bank, launched in February 2025, is positioned as a Question Mark within the BCG matrix. This new venture targets a high-growth market for both small businesses and consumers, an area AMP identified as underserved.
While the digital banking sector is experiencing rapid expansion, with projections indicating global digital banking users to reach over 3.6 billion by 2024, AMP's initial market share in this specific niche is notably low. This means the bank requires substantial investment to establish its presence and compete effectively.
The significant capital outlay, coupled with the nascent stage of market penetration, presents a high-risk profile. However, the substantial growth potential of the digital banking market, which saw fintech investment in banking reach $116 billion globally in 2023, suggests a possibility for high returns if AMP can successfully capture market share.
Specific Managed Portfolios (New or Niche)
Within the thriving North platform, new or niche managed portfolios are considered Stars. These offerings, while part of a successful overall segment, are still in their nascent stages of adoption. They exhibit strong growth potential, mirroring the broader managed portfolio trend, but currently hold a limited market share within their specialized sub-markets.

Expansion into New Asset Classes/Investment Strategies
AMP's strategic pivot involves increasing its stake in direct infrastructure and private credit. This move targets areas with substantial growth potential, reflecting a deliberate expansion beyond traditional offerings.
Furthermore, AMP is actively acquiring direct property funds that are currently trading at attractive discounts. This opportunistic approach aims to leverage market inefficiencies for enhanced returns.
These new strategies, while promising high growth, represent developing market share for AMP. As of early 2024, AMP's penetration in direct infrastructure and private credit is still in its nascent stages, indicating they are prime candidates for the 'question mark' category within the BCG matrix.
The potential upside is significant, as AMP seeks to build its presence and expertise in these burgeoning asset classes. For instance, the global infrastructure market is projected to see significant investment in the coming years, offering a fertile ground for AMP's expansion.
AI Assistant for Advisers
AMP's recently launched AI assistant for advisers represents a classic 'Question Mark' within the BCG matrix. This innovative tool aims to significantly reduce the administrative burden on financial advisers, a critical factor in an industry facing increasing regulatory complexity and client demands.
The market for AI-powered advisory tools is experiencing rapid evolution, indicating substantial growth potential. However, current adoption rates are relatively low, reflecting the nascent stage of this technology in the financial advisory sector. This combination of high growth potential and low market share firmly places it in the 'Question Mark' category.
- High Growth Potential: The demand for digital solutions to enhance efficiency in financial advice is escalating.
- Low Market Penetration: As a new offering, its current market share is minimal, highlighting the opportunity for expansion.
- Investment Required: Significant investment in further development and market education will be necessary to realize its potential.
- Strategic Decision Needed: AMP must decide whether to invest heavily to turn it into a 'Star' or divest if it fails to gain traction.
Strategic Partnerships for Growth
AMP's strategic partnerships, particularly its focus on securing new distribution agreements with Australian Financial Services Licensees (AFSLs) for its North platform, are a key growth driver. This initiative aims to expand AMP's reach by onboarding new financial advisers. For instance, in 2024, AMP reported that the North platform continued to attract advisers, with a steady increase in advisor numbers throughout the year, contributing to its market penetration efforts.
These partnerships function as investments in future market share expansion. While the groundwork is being laid through these agreements and adviser activations, the full impact on AMP's competitive positioning is still unfolding. The company is actively working to leverage these relationships to drive platform adoption and client acquisition.
The success of these strategic alliances can be measured by several key metrics:
- Growth in adviser numbers on the North platform.
- Increase in funds under management (FUM) flowing through new distribution channels.
- Market share gains within specific adviser segments.
AMP's High-Risk, High-Reward Ventures: Question Marks
Question Marks represent business ventures with low market share in high-growth industries. AMP's digital bank, AI assistant, and new infrastructure/private credit ventures exemplify this category. These initiatives require significant investment to capture market share, carrying a high risk but also the potential for substantial future returns if successful.
AMP's strategy involves carefully evaluating these Question Marks to determine whether to invest further to turn them into Stars or to divest if they do not gain sufficient traction. The success of these ventures hinges on AMP's ability to effectively navigate the competitive landscape and capitalize on market growth opportunities.
AMP's digital bank, launched in February 2025, targets a high-growth market with low initial penetration. Similarly, the AI assistant for advisers addresses an evolving market with nascent adoption rates. These are classic Question Marks, demanding strategic investment decisions.
AMP's expansion into direct infrastructure and private credit also falls under the Question Mark classification. These areas offer substantial growth potential, but AMP's current market share is developing, necessitating significant investment to build expertise and presence.
BCG Matrix Data Sources
Our BCG Matrix is constructed using comprehensive market data, encompassing financial performance, industry trends, and competitive analysis to offer a robust strategic overview.
