Crayon Group Boston Consulting Group Matrix
Fully Editable
Tailor To Your Needs In Excel Or Sheets
Professional Design
Trusted, Industry-Standard Templates
Pre-Built
For Quick And Efficient Use
No Expertise Is Needed
Easy To Follow
Crayon Group Bundle
Visual. Strategic. Downloadable.
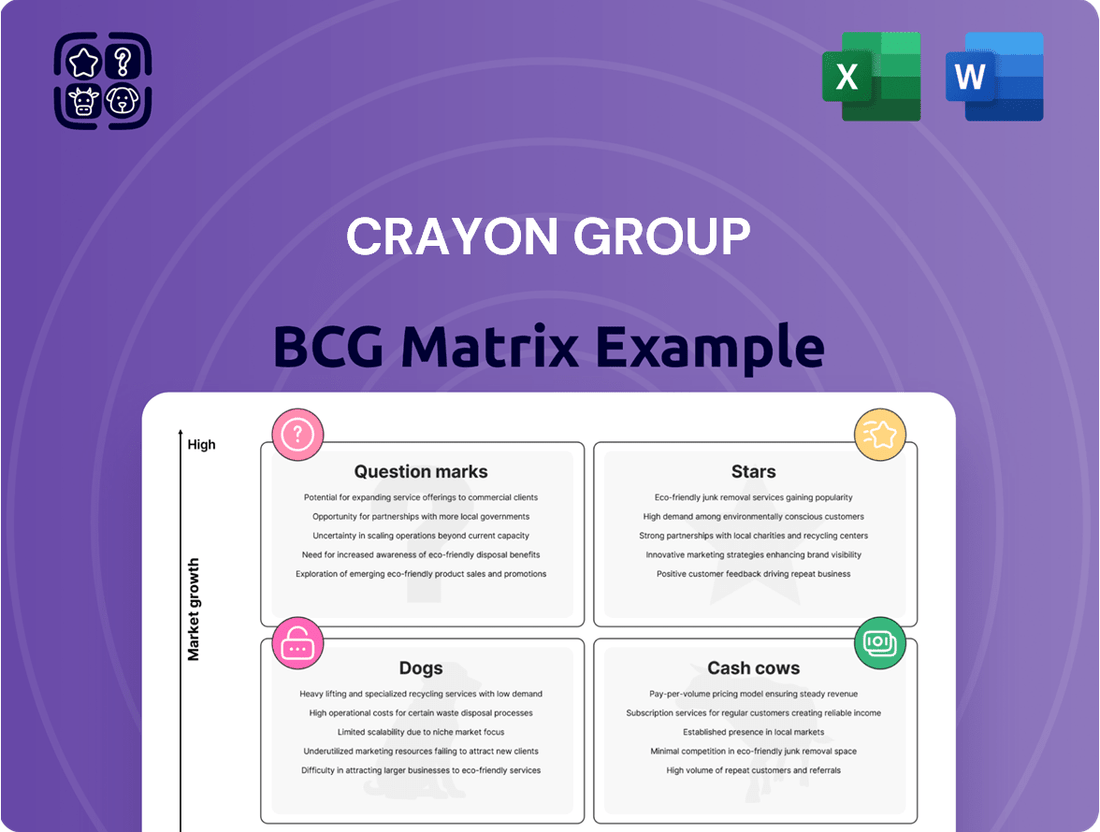
Explore Crayon Group's product portfolio through the BCG Matrix lens. This snapshot highlights key offerings across four strategic quadrants. Identify which products are market leaders, and which need closer attention. This preview only scratches the surface.
Get the full BCG Matrix report to uncover detailed quadrant placements, data-backed recommendations, and a roadmap to smart investment and product decisions.
Stars
Microsoft Cloud Solution Provider (CSP) Business
Crayon Group's Microsoft Cloud Solution Provider (CSP) business stands out due to a strong partnership. This segment is a high-growth area, expected to boost demand. Its focus on FinOps, AI, and software asset management aligns with Microsoft's priorities. In 2024, Microsoft's cloud revenue reached $97.1 billion, indicating the market's potential for Crayon. This strategic alignment fuels market share expansion.
Software and Cloud Channel Services
Crayon's Software and Cloud Channel Services, a Star in its BCG Matrix, saw robust growth in Q1 2025. This segment boasted a high EBITDA margin, reflecting its profitability. Services like license advisory and optimization for hosters and ISVs fueled this success. The Partner Connections program in ANZ is set to boost collaboration.

Data and AI Solutions
Crayon's Data and AI solutions are a "Star" in their BCG Matrix. They have a strong history of modernizing and innovating in this space. Their involvement in the AWS Generative AI Partner Innovation Alliance highlights their commitment. The market's rapid adoption of AI and modernized data platforms boosts their potential.
Consulting Services (specifically cloud migration and development)
Crayon's consulting services, especially cloud migration and development, experienced a notable boost in profitability during Q1 2025. This growth reflects the ongoing shift of businesses towards cloud solutions. The demand for these services is expected to stay robust. In 2024, the global cloud consulting market was valued at approximately $100 billion.
- Q1 2025 saw improved profitability in Crayon's cloud consulting.
- Cloud migration and development services are in high demand.
- The global cloud consulting market was worth around $100B in 2024.
International Markets (outside Nordics)
Crayon Group's international markets, including Europe, the US, and APAC & MEA, are shining stars. They experienced robust growth, compensating for a slower Q1 2025 in the Nordics. This demonstrates strong demand and opportunities for further expansion in these areas. In Q1 2024, Crayon saw significant revenue growth in APAC, with a 20% increase, and the US market grew by 15%.
- Strong revenue growth in APAC and the US.
- Offsetting softer performance in the Nordic region.
- Indicates strong demand.
- Potential for continued expansion.
High-Growth Markets Fueling Stellar Performance
Crayon Group's Stars, like their Microsoft CSP and Data & AI solutions, show robust growth in high-demand markets. Their Software & Cloud Channel Services also boast high profitability, reflecting strong market share. International markets, particularly APAC and the US, are key Stars, demonstrating substantial expansion and compensating for regional slowdowns. These segments collectively reflect Crayon's strategic focus on high-growth, high-profitability areas.
| Star Segment | Key Metric (2024/Q1 2025) | Value | ||
|---|---|---|---|---|
| Microsoft Cloud Market | Global Cloud Revenue (2024) | $97.1 Billion | ||
| Cloud Consulting | Global Market Value (2024) | ~$100 Billion | ||
| APAC Revenue Growth | Q1 2024 Increase | 20% | ||
| US Revenue Growth | Q1 2024 Increase | 15% | ||
| Software & Cloud Services | Q1 2025 Profitability | High EBITDA Margin |
What is included in the product
Analysis of Crayon Group's products, using the BCG Matrix to determine investment, holding, or divestment strategies.
Export-ready design allows rapid drag-and-drop into PowerPoint for seamless integration.
Cash Cows
Software Asset Management (SAM) Services
Crayon's Software Asset Management (SAM) services are a Cash Cow, leveraging their extensive history and expertise. Crayon is recognized as a Leader in the Gartner Magic Quadrant for SAM Managed Services. This mature market yields stable revenue, with Crayon's SAM revenue contributing significantly to its financial stability. In 2024, Crayon's revenue from SAM services was approximately $150 million.
Software and Cloud Direct Services
Software and Cloud Direct Services, a cash cow for Crayon Group, demonstrated steady growth in Q1 2025. This segment, featuring software licenses, maintained a solid EBITDA margin. In Q1 2025, this segment contributed significantly to overall revenue. It's a core business with established customer relationships.

IT Cost Management (including Cloud Cost Control and License Optimization)
Crayon's IT cost management services, including cloud cost control and license optimization, are a strong "Cash Cow" in their BCG Matrix. Businesses increasingly seek to optimize IT spending, making these services highly valuable. In 2024, the global cloud cost optimization market was valued at approximately $2.5 billion, with significant growth projected. Crayon's SAM and FinOps capabilities directly address this market need.
Public Sector Agreements
Crayon's public sector agreements are strategically crucial. These deals often start with lower margins but offer steady, long-term income. They create chances for additional sales and upgrades down the road. For instance, in 2024, Crayon secured a significant contract with a government agency, projecting a stable revenue of $15 million over five years.
- Stable Revenue: Agreements ensure consistent income.
- Long-Term Potential: Contracts span several years.
- Upselling Opportunities: Chances to offer more services.
- Cross-Selling: Expand with related products.
Established Partnerships (e.g., with Microsoft and AWS)
Crayon Group benefits from established alliances, particularly with tech giants Microsoft and AWS. These partnerships are crucial, underpinning a substantial part of their revenue stream. They fortify Crayon's market presence in crucial service sectors. These relationships are central to their cash-generating capabilities.
- In 2024, Microsoft and AWS contributed significantly to Crayon's revenue, accounting for a large percentage.
- These partnerships ensure access to cutting-edge technologies and solutions.
- Crayon leverages these alliances to expand its market reach.
- The collaborations promote customer loyalty and repeat business.
Crayon's Foundation: Stable Revenue & Strategic Alliances
Crayon's Cash Cows are foundational, mature business segments generating substantial, stable cash flow with low growth but high market share. These include robust Software Asset Management and IT cost optimization services.
In 2024, Crayon's SAM revenue was approximately $150 million, while public sector contracts secured $15 million over five years. Strategic alliances with Microsoft and AWS also contributed significantly to 2024 revenues.
These segments provide the essential capital for Crayon to invest in developing new offerings and expanding into emerging markets, ensuring sustained financial health.
| Segment | 2024 Revenue (Approx.) | Contribution |
|---|---|---|
| SAM Services | $150M | Stable, high margin |
| Public Sector | $15M (5-yr avg.) | Long-term, predictable |
| MSFT/AWS Alliances | Significant % | Core revenue driver |
Delivered as Shown
Crayon Group BCG Matrix
The BCG Matrix preview is identical to the purchased document. Expect a fully functional, professionally designed report—no hidden content or alterations after you buy.

Dogs
Underperforming Enterprise Software Sales
Crayon Group's enterprise software sales underperformed in Q4 2024, affecting gross profit. This indicates potential challenges or rising competition within this segment. For example, Crayon's Q4 2024 gross profit growth was down by 3% compared to the previous year. This area needs strategic attention.
Certain Parts of the Nordics Performance
In Q1 2025, Crayon's Nordic performance was uneven, with some areas underperforming. This affected the overall results, hinting at localized market issues. For instance, in 2024, Crayon's revenue from the Nordics was $300M, a 5% growth, yet some segments lagged.

Services with Low Profitability or Growth
Services at Crayon with low profitability or growth, such as those with limited market share or growth potential, are "Dogs." Identifying these requires analyzing service line performance. Examining specific offerings is key, as internal data reveals underperforming segments. For example, in 2024, Crayon's specific segments saw a decline in revenue.
Legacy IT Services (if any with declining demand)
If Crayon Group still provides legacy IT services unrelated to cloud or digital transformation, these could be classified as Dogs. The demand for these services likely declines as businesses shift towards modern IT solutions. For example, in 2024, traditional IT services saw a decrease in market share compared to cloud-based solutions.
- Declining market demand for legacy IT services.
- Crayon's focus is on modern IT solutions.
- Older services might still exist but are not a focus.
- Market shift towards cloud and digital transformation.
Specific Geographies with Weak Performance
The "Dogs" quadrant for Crayon Group, as per the BCG Matrix, highlights geographies with weak performance and low market share. While specific data from 2024 isn't available yet, we can analyze 2023 trends to anticipate potential "Dogs." Areas beyond the Nordics, such as specific Eastern European countries where Crayon has a limited presence, might fit this profile. This assessment requires detailed geographical revenue breakdowns to identify underperforming regions.
- Eastern Europe: Potential for low market share and growth challenges, based on historical data.
- Detailed geographical revenue analysis is crucial to pinpoint struggling regions.
- Focus on areas where Crayon's market share is significantly below the average.
Underperforming Areas Identified as "Dogs"
Crayon Group's "Dogs" include underperforming segments like enterprise software sales, which saw a 3% decline in gross profit growth in Q4 2024, and uneven Nordic performance. Legacy IT services, experiencing decreased market share in 2024, also fit this category. Geographies with low market share and growth, such as specific Eastern European countries, are also classified as Dogs, requiring strategic divestment or significant redirection of resources.
| Segment/Area | 2024 Performance | BCG Classification |
|---|---|---|
| Enterprise Software Sales | Q4 2024 Gross Profit Growth: -3% | Dog |
| Legacy IT Services | Decreased Market Share (2024) | Dog |
| Eastern Europe (Specifics) | Low Market Share/Growth (Estimated) | Dog |
Question Marks
Newly Launched Cybersecurity Assessment Services
Crayon Group's recent launch of cybersecurity assessment services taps into a growing market. However, it's still early to gauge the full market share and profitability of these new services. The global cybersecurity market was valued at $200 billion in 2024. This expansion offers potential but needs further evaluation.
Expansion into New Markets
Crayon is eyeing expansion into new markets, a move signaling growth ambitions. These markets will start with a low market share, posing challenges. Significant upfront investment is needed to build a strong foothold. For instance, Crayon's revenue in 2024 was approximately $1.2 billion, with a projected increase of 15% by 2025, suggesting the need for strategic capital allocation for new market entries.

New AI and Generative AI Projects
Crayon Group's new AI and generative AI projects are likely in the early stages. These initiatives require substantial investment, reflecting the industry's average R&D spend of 15-20% of revenue in 2024. Immediate returns may be uncertain, mirroring the volatility seen in tech stocks, with AI firms experiencing an average annual growth of 20% in 2024. The potential for future growth, however, is high, aligning with the projected global AI market size of over $200 billion by the end of 2024.
Strategic Acquisitions (Integration Phase)
Crayon's strategic acquisitions, such as its integration with SoftwareOne, place it in the "Question Marks" quadrant of the BCG matrix. This phase often demands significant capital for integration, potentially impacting short-term profitability. The benefits of increased market share and profitability from these acquisitions take time to materialize. For example, in 2024, SoftwareOne's revenue was $2.8 billion, but integration costs reduced net income.
- High investment required for integration.
- Uncertainty in realizing full profitability.
- Focus on capturing market share.
- Requires careful cash flow management.
Development of Proprietary Software/Tools
Crayon Group's investment in proprietary software, a Question Mark in the BCG Matrix, involves significant R&D spending. This strategy aims to create a competitive edge through innovative tools. Success hinges on wider adoption and market impact. In 2024, R&D spending in the tech sector averaged 7.5% of revenue, highlighting the investment intensity.
- High R&D investment is typical.
- Goal is a competitive advantage.
- Success depends on market adoption.
- Tech sector R&D spending is high.
High-Growth Ventures: Investment & Market Dynamics
Crayon Group’s Question Marks, such as new AI initiatives and market expansions, require substantial investment with uncertain immediate returns. These ventures, including cybersecurity services and proprietary software, currently hold low market share but offer high growth potential. For instance, the global AI market is projected to exceed $200 billion by the end of 2024. Success hinges on strategic capital allocation and market adoption.
| Initiative | 2024 Investment Trend | 2024 Market Size/Revenue |
|---|---|---|
| Cybersecurity Services | Early stage, high potential | $200 billion (global market) |
| AI & Gen AI Projects | Substantial R&D (15-20% of revenue) | >$200 billion (global AI market) |
| New Market Expansion | Significant upfront capital | Crayon revenue ~$1.2 billion |
BCG Matrix Data Sources
Crayon's BCG Matrix is built using financial data, market trends, and industry analysis for dependable strategic insights.
