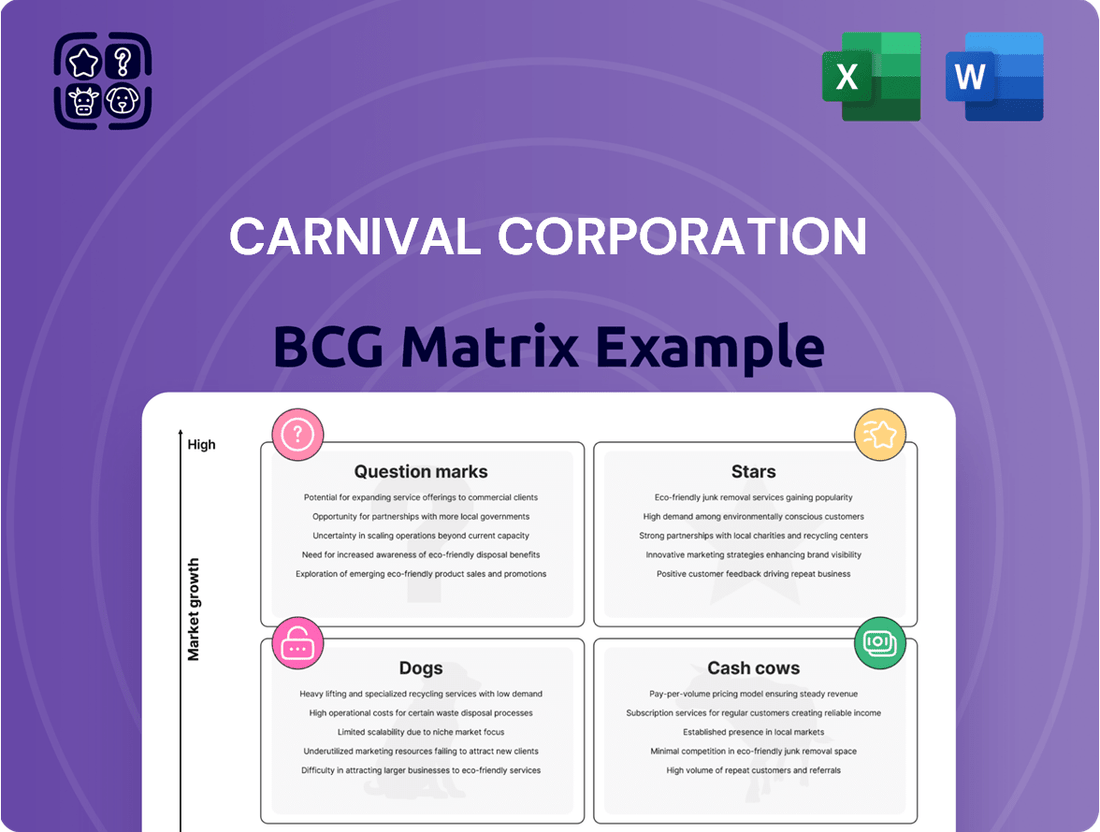
Carnival Corporation Boston Consulting Group Matrix
Fully Editable
Tailor To Your Needs In Excel Or Sheets
Professional Design
Trusted, Industry-Standard Templates
Pre-Built
For Quick And Efficient Use
No Expertise Is Needed
Easy To Follow
GET THE FULL COMPANY
ANALYSIS BUNDLE FOR
Carnival Corporation
See the Bigger Picture
Carnival Corporation's diverse fleet presents a fascinating case study for the BCG Matrix. Are their established cruise lines generating consistent profits, or are newer, innovative ventures poised for explosive growth? Understanding these dynamics is crucial for any investor or strategist.
Dive deeper into Carnival Corporation's BCG Matrix and gain a clear view of where its brands stand—Stars, Cash Cows, Dogs, or Question Marks. Purchase the full version for a complete breakdown and strategic insights you can act on.
Stars
Carnival Cruise Line's Core Brand Growth
Carnival Cruise Line stands out as a Star in Carnival Corporation's portfolio, consistently delivering the highest returns. Its robust performance is fueled by exceptionally strong consumer demand, making it a cornerstone of the company's strategy.
To capitalize on this sustained high demand, Carnival Corporation is actively investing in Carnival Cruise Line's expansion. This includes significant new ship orders, with the company expecting delivery of several new vessels through 2025, and strategic fleet transfers from other brands. For instance, in 2024, Carnival Cruise Line is set to introduce its Excel-class ships, further bolstering capacity and guest experience.
Record-Breaking Bookings and Yields
Carnival Corporation reported a record $25 billion in revenue for the full year 2024. This financial success is bolstered by unprecedented cumulative advanced bookings for 2025, setting new highs for both price and occupancy. These figures strongly suggest Carnival holds a dominant market share within a flourishing industry, with sustained demand fueling its impressive financial performance.

New Class of High-Capacity Vessels
Carnival Corporation's strategic order for a new class of high-capacity vessels, with deliveries beginning in 2029, signals a significant investment in future growth. These ships, boasting nearly 230,000 gross registered tonnes and accommodating close to 8,000 guests, will become the largest in the company's fleet.
This move is designed to capture a greater share of the expanding cruise market by offering enhanced guest experiences. The substantial investment in these larger, more efficient vessels underscores the high growth prospects anticipated for the Carnival Cruise Line brand.
Strategic Fleet Optimization and Transfers
Carnival Corporation is strategically enhancing its flagship brand by integrating five vessels into the Carnival Cruise Line fleet. This fleet optimization, occurring between 2023 and March 2025, directly supports Carnival Cruise Line's position as a top performer within the corporation's diverse brand portfolio.
This influx of capacity is designed to meet robust guest demand, bolstering Carnival Cruise Line's ability to leverage its market leadership. By consolidating resources, Carnival Corporation aims to amplify the growth and profitability of its most successful brand.
- Fleet Transfers: Five vessels are being moved to Carnival Cruise Line.
- Timeline: These transfers are scheduled from 2023 through March 2025.
- Strategic Rationale: To increase capacity for the highest-returning brand and capitalize on strong demand.
- Impact: Enhances Carnival Cruise Line's market position and growth trajectory.
Innovation and Enhanced Guest Experience
Carnival Cruise Line's 'Innovation Itinerary' is a key driver for enhancing the guest experience, focusing on a fun fleet and compelling destinations to foster customer loyalty.
This strategy involves significant upgrades to existing vessels, such as modernizing decor and introducing novel dining and entertainment options. For example, in 2024, Carnival continued its fleet enhancement programs, aiming to elevate the onboard atmosphere. This commitment to continuous improvement is crucial for maintaining a strong competitive edge in a dynamic and expanding cruise market, thereby securing a substantial market share.
- Fleet Modernization: Ongoing investments in ship upgrades and new builds.
- Guest Experience Focus: Introduction of new dining, entertainment, and immersive onboard activities.
- Destination Innovation: Development of unique itineraries and port experiences.
- Loyalty Programs: Enhancements to reward and retain repeat customers.
The Cruise Line's Stellar Performance: A Deep Dive
Carnival Cruise Line is a clear Star in Carnival Corporation's portfolio, consistently generating the highest returns due to exceptionally strong consumer demand. The company is actively investing in its expansion through new ship orders and fleet transfers, with several Excel-class ships joining the fleet through 2025, including new deliveries in 2024.
Carnival Corporation achieved a record $25 billion in revenue for 2024, supported by unprecedented advance bookings for 2025, indicating a dominant market share in a growing industry.
The brand's strategic focus on enhancing the guest experience through fleet modernization and innovative itineraries, like the 'Innovation Itinerary,' further solidifies its market leadership and growth prospects.
| Brand | Market Share | Growth Rate | Profitability | Investment Level |
|---|---|---|---|---|
| Carnival Cruise Line | High | High | High | High |
What is included in the product
The Carnival Corporation BCG Matrix offers a strategic overview of its cruise brands, categorizing them as Stars, Cash Cows, Question Marks, or Dogs.
This analysis guides investment decisions, highlighting which brands to nurture, maintain, develop, or divest for optimal portfolio performance.
The Carnival Corporation BCG Matrix provides a clear, one-page overview, relieving the pain of deciphering complex business unit performance.
Cash Cows
Established Brand Portfolio
Carnival Corporation's established brand portfolio, featuring iconic names like Princess Cruises and Holland America Line, represents its Cash Cows. These brands hold significant market share within the mature cruise industry, consistently generating substantial revenue.
In 2024, Carnival Corporation continued to benefit from the strong brand recognition and customer loyalty associated with these legacy cruise lines. The company reported robust performance from these segments, underscoring their role as reliable cash generators.
Strong Onboard Revenue Generation
Carnival Corporation's established fleet thrives on onboard revenue, a significant cash cow beyond ticket sales. This includes robust spending on food, beverages, casinos, spas, and shore excursions.
This consistent, high-margin revenue stream from a captive audience is a vital contributor to Carnival's cash flow. In 2024, onboard spending saw a notable acceleration, underscoring its reliability.

High Occupancy Rates
Carnival Corporation's occupancy rates are a clear indicator of its cash cow status. In the first quarter of 2025, the company reported an impressive 103% occupancy, a notable increase from the 102% seen in the first quarter of 2024. This signifies that Carnival is maximizing the use of its current fleet, essentially operating at full capacity and beyond.
This consistent high occupancy, especially within a well-established cruise market, is a classic characteristic of a cash cow. It means Carnival is generating substantial, reliable revenue from its existing assets with minimal need for further investment to drive growth. The company is effectively leveraging its infrastructure to its fullest potential.
Efficient Debt Management and Reduced Interest Expense
Carnival Corporation's strategic approach to debt management significantly bolsters its Cash Cow status. By actively refinancing and reducing its debt burden, the company frees up substantial capital. For instance, in Q1 2025, Carnival refinanced $5.5 billion in debt, projecting an annual interest savings of $145 million. This financial discipline directly enhances profitability by lowering operational costs.
- Debt Refinancing: Carnival refinanced $5.5 billion in Q1 2025.
- Annual Interest Savings: Expected to save $145 million annually.
- Profitability Boost: Reduced interest expense directly increases net income.
- Capital Retention: Focus on efficiency allows more cash to be retained from operations.
Consistent Customer Deposits
Carnival Corporation's consistent customer deposits are a prime example of a Cash Cow within its BCG Matrix. The company achieved a record $7.3 billion in total customer deposits during the first quarter of 2025. This significant figure underscores the robust demand for Carnival's services and highlights a strong preference for its core cruise offerings in an established market.
This substantial deposit base signifies a stable and predictable cash flow, a hallmark of a Cash Cow. It reflects not only increasing ticket prices but also a healthy rise in pre-cruise onboard sales, indicating strong customer engagement and loyalty. This financial stability allows Carnival to fund its operations and investments without significant reliance on external financing.
- Record Deposits: $7.3 billion in Q1 2025.
- Growth Drivers: Increased ticket prices and pre-cruise onboard sales.
- Market Position: Demonstrates high customer loyalty in a mature cruise market.
- Financial Impact: Provides stable and predictable cash inflow.
Cruising to Profits: Strong Deposits & High Occupancy!
Carnival Corporation's established brands, coupled with high occupancy rates and strong customer deposits, solidify their Cash Cow status. These segments consistently generate substantial, predictable revenue with minimal investment required for growth.
In the first quarter of 2025, Carnival reported a record $7.3 billion in customer deposits, showcasing robust demand and loyalty. This, alongside an impressive 103% occupancy in Q1 2025, demonstrates the efficient utilization of existing assets.
The company's strategic debt refinancing, including $5.5 billion in Q1 2025, further enhances profitability by reducing interest expenses, projected to save $145 million annually.
These factors combine to create a stable, high-margin cash flow, allowing Carnival to effectively manage its operations and investments.
| Segment | Market Share | Revenue Generation | Investment Need |
|---|---|---|---|
| Princess Cruises | High | Consistent & Substantial | Low |
| Holland America Line | High | Consistent & Substantial | Low |
| Onboard Revenue | N/A | High Margin & Predictable | Low |
What You See Is What You Get
Carnival Corporation BCG Matrix
The Carnival Corporation BCG Matrix preview you are currently viewing is the exact, fully formatted report you will receive upon purchase. This means no watermarks, no demo content, and no hidden surprises – just a comprehensive, analysis-ready document designed for immediate strategic application.
Rest assured, the BCG Matrix you see now is the final, polished version that will be delivered to you after your purchase. It's meticulously crafted to provide clear insights into Carnival Corporation's business units, allowing for informed decision-making without any need for further editing or revisions.
What you are previewing is the actual, complete Carnival Corporation BCG Matrix document that you will download immediately after completing your purchase. This professionally designed file is ready for immediate use, whether for internal strategy sessions, client presentations, or further in-depth business planning.

Dogs
P&O Cruises Australia Divestiture
P&O Cruises Australia is being sunsetted, with its operations integrating into Carnival Cruise Line by March 2025. This strategic move, including the Pacific Explorer's departure in February 2025, signals that P&O Cruises Australia likely held a low market share and limited growth potential within Carnival Corporation's broader portfolio.
This divestiture aligns with the BCG matrix concept of 'Dogs,' which are business units or products with low market share and low growth prospects. Such actions are common for companies looking to streamline operations and reallocate resources to more promising ventures.
Older, Less Efficient Ships
Carnival Corporation's strategy involves retiring older, less efficient ships. These vessels often come with higher fuel consumption and maintenance expenses, impacting overall profitability. For instance, in 2023, Carnival completed the divestment of several older ships, contributing to a more fuel-efficient fleet.
These older ships typically generate lower guest satisfaction scores and struggle to compete with newer, amenity-rich vessels. Their removal is crucial for maintaining market share and improving the guest experience. By phasing out these assets, Carnival can better allocate capital towards modernizing its fleet and enhancing its brand image.

Underperforming Niche Segments
Underperforming niche segments within Carnival Corporation's extensive fleet, while not always branded as distinct entities, represent areas that consistently struggle with occupancy or profitability. These could be specific itineraries or smaller, less popular vessel classes that, despite overall market demand, fail to generate sufficient revenue. For instance, if a particular cruise route experiences persistently low booking rates, it might be classified as an underperformer, draining operational resources.
Carnival's strategic approach often involves reallocating assets to more successful brands, a move that implicitly identifies and addresses these weaker segments. By transferring vessels from underperforming routes or brands to those with higher yields, the company aims to optimize its portfolio. This strategy was evident in 2023 and continued into early 2024, as Carnival focused on enhancing fleet-wide profitability by shedding older, less efficient ships and concentrating on its most lucrative brands.
High Dry-Dock Days Impacting Costs
Carnival Corporation anticipates that increased dry-dock days will affect its second-quarter 2025 cruise operating costs. These periods are essential for ship upkeep, but extended or frequent dry-docking for certain vessels can reduce revenue and raise operational expenses.
This situation can temporarily make these ships cash flow negative, particularly if they are older and require more intensive maintenance. For example, in 2024, Carnival has been managing a fleet optimization program that includes strategic dry-docking. The company reported in its Q1 2024 earnings call that approximately 10% of its fleet capacity was impacted by dry-docking during the first quarter, a figure that fluctuates seasonally.
- Increased Dry-Dock Frequency: Expecting higher dry-dock days in Q2 2025.
- Revenue Reduction: Ships out of service during dry-docking generate no revenue.
- Operational Expense Increase: Costs associated with maintenance and shipyard services.
- Cash Flow Impact: Temporary negative cash flow contribution from affected vessels.
Brands with Limited Growth Potential in Specific Regions
Some of Carnival Corporation's smaller or regionally focused brands might be in markets with limited expansion opportunities. These brands, while potentially stable, could be facing intense local competition, hindering their ability to grow market share significantly.
If these brands exhibit stagnation and struggle to increase their presence, they could be categorized as Dogs within Carnival's portfolio. This classification suggests they might not be actively contributing to overall growth, even if they are not slated for immediate divestment.
- Limited Market Expansion: Brands operating in mature or saturated regional markets face inherent growth ceilings.
- Intense Local Competition: Strong established local players can make it difficult for smaller brands to gain traction.
- Stagnant Market Share: A consistent failure to capture a larger portion of the regional market signals a potential Dog status.
- Potential for Divestment: While not immediate, underperforming brands in low-growth areas are candidates for future strategic review.
P&O Australia's Sunset: A 'Dog' in Carnival's Pack?
Carnival Corporation's decision to sunset P&O Cruises Australia, with operations integrating into Carnival Cruise Line by March 2025, strongly suggests P&O Australia was a 'Dog' within its portfolio. This classification aligns with businesses possessing low market share and low growth prospects, indicating a strategic move to optimize resource allocation towards more profitable segments of the company.
The phasing out of older, less efficient ships, which often incur higher maintenance costs and lower guest satisfaction, also points to 'Dog' characteristics. Carnival's 2023 divestment of several older vessels exemplifies this strategy, aiming for a more fuel-efficient and modern fleet.
Underperforming niche segments, such as specific routes with persistently low booking rates, can also be considered 'Dogs.' Carnival's ongoing fleet optimization, including strategic dry-docking in 2024, aims to shed these less lucrative assets and concentrate on high-yield brands.
Smaller, regionally focused brands in markets with limited expansion opportunities and intense local competition may also fall into the 'Dog' category. These brands, while potentially stable, might struggle to grow market share, signaling a potential need for future strategic review.
Question Marks
New Exclusive Destination: Celebration Key
Celebration Key, Carnival Corporation's new exclusive destination set to open in July 2025, is poised to be a significant growth driver. While its potential is high, its current market share is naturally low as a new offering, placing it in the 'Question Mark' category of the BCG matrix. Carnival will need to invest heavily in marketing and operational excellence to ensure its success and transition it into a 'Star' performer.
Long-Term LNG-Powered Ship Orders (Project Ace)
Carnival Corporation's Project Ace, encompassing LNG-powered ship orders with deliveries in 2029, 2031, and 2033, represents a significant long-term investment in sustainable maritime technology. These future assets, while promising for environmental compliance and operational efficiency, currently contribute minimally to revenue, placing them in the 'Question Mark' category of the BCG matrix. The substantial upfront capital required for these advanced vessels, estimated in the billions of dollars across the fleet, underscores their potential for future growth but also their current lack of established market presence or profitability.

Expansion at RelaxAway, Half Moon Cay
Carnival Corporation's planned expansion at RelaxAway on Half Moon Cay, slated for 2026, signifies a strategic move to bolster its private island offerings. This investment aims to tap into the increasing consumer desire for exclusive and immersive vacation experiences.
While private islands generally boost guest satisfaction and revenue potential, the specific return on this particular expansion remains a future consideration. It represents a Question Mark within Carnival's portfolio, dependent on market reception and seamless integration into existing cruise routes to ensure its success.
AI-Powered Food Waste Reduction Systems
Carnival Corporation is exploring AI-powered food waste reduction systems, a move that aligns with its 2030 goal of cutting food waste by 50%. While this technology offers significant environmental and cost-saving benefits, its direct revenue generation is currently minimal, positioning it as a Question Mark within the BCG Matrix.
These systems utilize real-time data to optimize inventory, predict demand, and manage portion control, thereby minimizing spoilage and overproduction. The success of these initiatives in achieving substantial operational efficiencies and potentially creating new revenue streams through waste valorization will be key to their future classification.
- AI Integration: Carnival is implementing AI to analyze consumption patterns and forecast demand, aiming to reduce over-ordering and waste.
- Waste Reduction Target: The company has set an ambitious target of a 50% reduction in food waste by 2030.
- Cost Savings Potential: Reduced food waste directly translates to lower purchasing costs and improved operational efficiency, though immediate revenue impact is low.
- Future Growth: The long-term success hinges on scaling these AI solutions across its fleet and demonstrating a clear ROI, making it a strategic investment with uncertain immediate returns.
Developing More Energy-Efficient Itineraries
Carnival Corporation is actively pursuing more energy-efficient itineraries, a key component of its broader sustainability strategy aimed at significantly reducing greenhouse gas emissions. This initiative focuses on optimizing cruise routes and onboard operations to achieve substantial fuel savings. For instance, in 2023, Carnival reported a 13.4% improvement in fuel efficiency compared to 2019, demonstrating tangible progress in this area.
While this focus on efficiency is vital for long-term environmental stewardship and cost control, its direct impact on immediate market share or revenue generation is not substantial. This positions 'energy-efficient itineraries' as a Question Mark within the BCG Matrix. It necessitates continued investment to maintain competitive advantage and meet evolving environmental regulations.
- Sustainability Goals: Carnival aims to reduce its carbon intensity by 40% by 2030 compared to a 2019 baseline.
- Operational Optimization: Route planning and speed adjustments are key tactics to minimize fuel consumption.
- Market Position: Low immediate market share impact, but crucial for future regulatory compliance and brand reputation.
- Investment Needs: Ongoing investment is required for technology upgrades and route analysis to sustain efficiency gains.
New Tech & Destinations: High Risk, High Reward
Carnival Corporation's investment in new technologies and destinations, like Celebration Key and AI-driven waste reduction, currently represents potential growth areas with low market share. These initiatives require substantial upfront capital and ongoing investment to prove their viability and transition into market leaders. Their success hinges on market acceptance and operational execution, placing them firmly in the Question Mark quadrant of the BCG matrix.
| Initiative | BCG Category | Market Share | Growth Potential | Investment Needs |
|---|---|---|---|---|
| Celebration Key | Question Mark | Low (New) | High | Significant (Marketing, Operations) |
| Project Ace (LNG Ships) | Question Mark | Minimal (Future) | High | Billions (Capital Expenditure) |
| RelaxAway Expansion | Question Mark | Low (Specific to expansion) | Moderate to High | Capital Investment |
| AI Food Waste Reduction | Question Mark | Minimal (Operational) | Moderate (Cost Savings) | Technology Investment |
| Energy-Efficient Itineraries | Question Mark | Low (Operational) | Moderate (Cost Savings, Compliance) | Ongoing (Technology, Analysis) |
BCG Matrix Data Sources
Our Carnival Corporation BCG Matrix is constructed using a blend of financial disclosures, industry growth forecasts, and competitor performance data to accurately position each business unit.
